2.9 Waveform Display
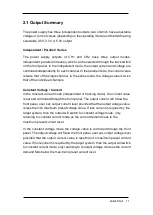
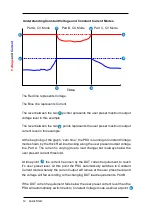
The T3PS3000 can display the changing voltage and current values in real time
as a waveform plot.
Operation:
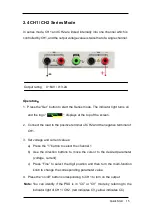
1. Select CH1 / CH2, then set the voltage / current parameters.
2. Press the “Wavedisp” button to enter the Waveform Display interface.
The indicator light turns on immediately.
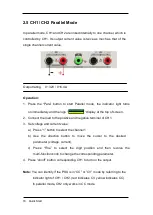
3. Press CH1 / CH2 “On/Off” button to turn on the output. The corresponding
indicator light turns on immediately, and you can observe the real-time
changes of the voltage or current on the display.
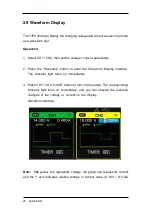
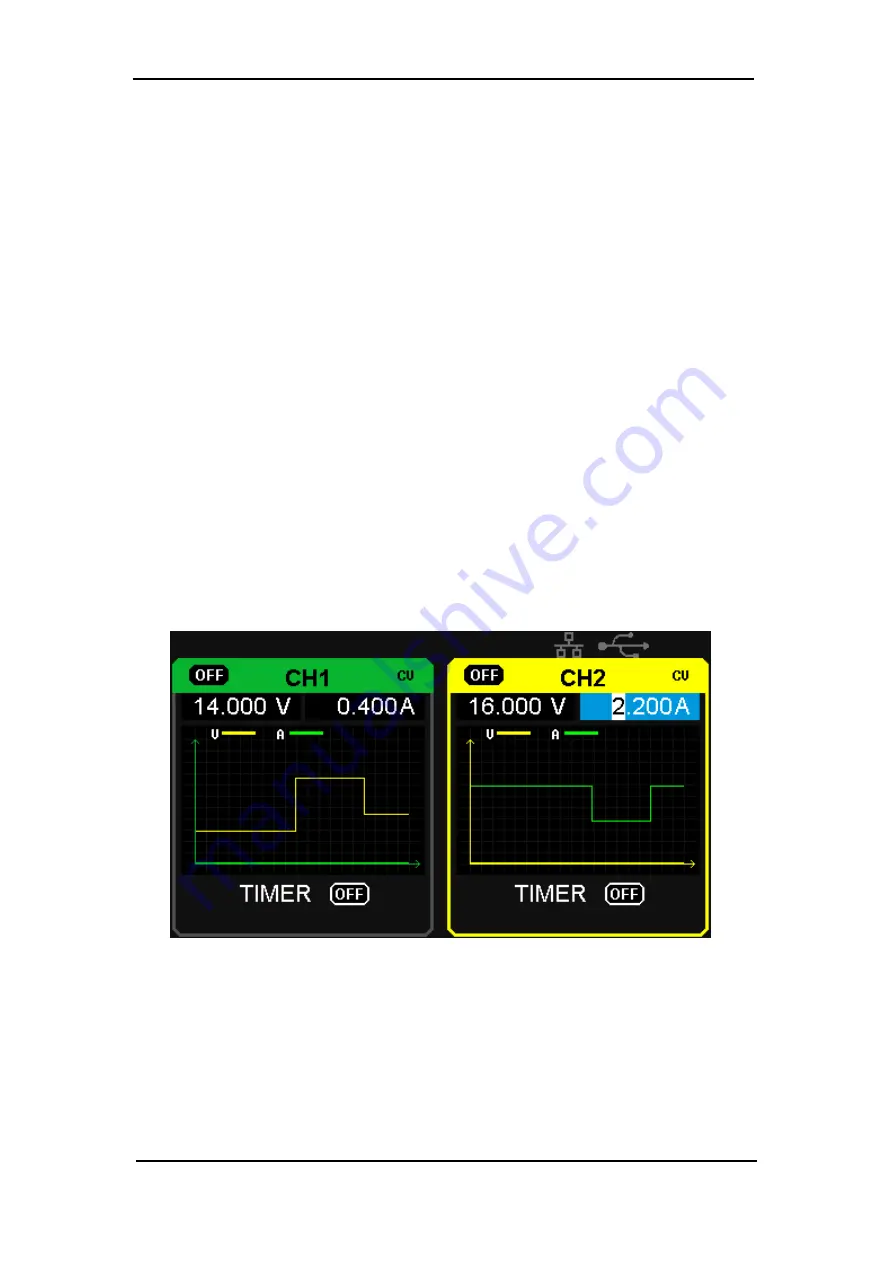
Waveform interface:
Note: The
yellow line represents voltage, the green line represents current,
and the Y axis indicates relative voltage or current value (0~32V / 0~3.2A).
22 Quick Start


