-5-
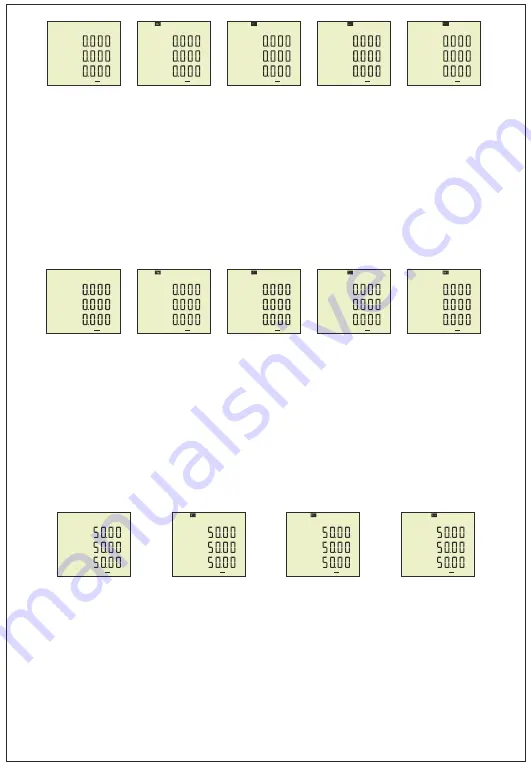
Figure-21:
It shows the frequency values of each phase. The figure-22 is displayed when you press the
Down button.
Figure-22:
It shows the minimum frequency values of each phase. The figure-23 is displayed when you
press the Down button.
Figure-23:
It shows the maximum frequency values of each phase. The figure-24 is displayed when you
press the Down button.
Figure-24:
It shows the mean frequency values of each phase. The
Home Screen
is displayed when you
press the Down button.
L1
L2
L3
F
Out1
Hz
Hz
Hz
Figure-21
F
Out1
Hz
Hz
Hz
Figure-22
F
Out1
Hz
Hz
Hz
Figure-23
F
Out1
Hz
Hz
Hz
Figure-24
Figure-16:
It shows the apparent power values of each phase. The figure-17 is displayed when you press
the Down button.
Figure-17:
It shows the minimum apparent power values of each phase. The figure-1
8
is displayed when
you press the Down button.
Figure-18:
It shows the maximum apparent power values of each phase. The figure-1
9
is displayed when
you press the Down button.
Figure-19:
It shows the mean apparent power
values of each phase. The figure-
20
is displayed when you
press the Down button.
Figure-20:
It shows the apparent power demand values of each phase. The figure-
21
is displayed when
you press the Down button.
Figure-16
L1
L2
L3
S
kVA
kVA
kVA
Out1
Figure-18
L1
L2
L3
S
kVA
kVA
kVA
Out1
S
kVA
kVA
kVA
Out1
Şekil-20
S
L1
L2
L3
kVA
kVA
kVA
Out1
Figure-19
S
L1
L2
L3
kVA
kVA
kVA
Out1
Figure-17
L1
L2
L3
L1
L2
L3
I
A
A
A
Out1
L1
L2
L3
I
A
A
A
Out1
L1
L2
L3
I
A
A
A
Out1
L1
L2
L3
I
A
A
A
Out1
L1
L2
L3
I
A
A
A
Out1
Figure-11
Figure-12
Figure-13
Figure-15
Figure-14
Figure-11:
It shows the current values of each phase. The figure-12 is displayed when you press the
Down button.
Figure-12:
It shows the minimum current values of each phase. The figure-13 is displayed when you
press the Down button.
Figure-13:
It shows the maximum current values of each phase. The figure-14 is displayed when you
press the Down button.
Figure-14:
It shows the mean current values of each phase. The figure-15 is displayed when you press
the Down button.
Figure-15:
It shows the current demand current values of each phase. The figure-16 is displayed when
you press the Down button.
-6-
Figure-31
Figure-30
Figure-27
Figure-28
Figure-25:
Press Menu button to enter password section. The figure-26 is displayed when you enter
password and press the Menu button.
Figure-26:
It uses for voltage settings. The figure-27 is displayed when you press the UP button.
Figure-27:
It uses for current settings. The figure-28 is displayed when you press the UP button.
Figure-28:
It uses for frequency settings. The figure-29 is displayed when you press the UP button.
Figure-29:
It uses for RS-485 settings. The figure-30 is displayed when you press the UP button.
Figure-30:
It uses for general settings. The figure-31 is displayed when you press the UP button.
Figure-31:
It uses for about the device. This section give a information about device serial number and
version number. You can use ESC button for exit menu.
Figure-25
Figure-26
12 - Settings:
Figure-29
Set
The Home screen is displayed, when the device is energized. When you press the up button to see the
other data on the display, the next data is displayed (Figure-3).
The figure-7 is displayed when you press the
Up button. The figure-11 is displayed when you press the Up button. The figure-16 is displayed when you
press the Up button. The figure-21 is displayed when you press the Up button. The screen back to
Home Screen when you press the Up button.
I
f you want to see values of min,max,mean and demand you can use down button. If you back to
home screen in anywhere, you can use ESC button.
11 - To advance in Display Inventory:
L1
L2
L3
V
A
A
A
Out1
Home
Screen
Figure-3
L12
L23
L31
V
V
V
V
Out1
Figure-7
L1
L2
L3
I
A
A
A
Out1
Figure-11
L1
L2
L3
F
Out1
Hz
Hz
Hz
Figure-21
L1
L2
L3
S
Var
Var
Var
Out1
Din1
Figure-16
I
L1
L2
L3
V
V
V
V
Out1


