TI-83 Plus
Function Graphing
140
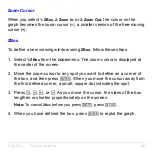
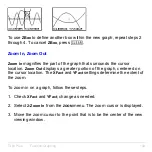
To use
ZBox
to define another box within the new graph, repeat steps 2
through 4. To cancel
ZBox
, press
‘
.
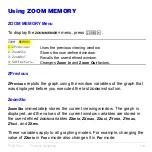
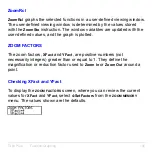
Zoom In, Zoom Out
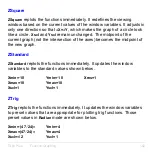
Zoom In
magnifies the part of the graph that surrounds the cursor
location.
Zoom Out
displays a greater portion of the graph, centered on
the cursor location. The
XFact
and
YFact
settings determine the extent of
the zoom.
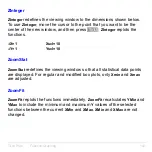
To zoom in on a graph, follow these steps.
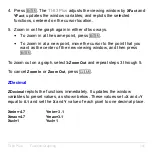
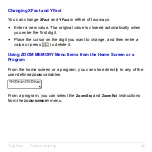
1. Check
XFact
and
YFact
; change as needed.
2. Select
2:Zoom In
from the
ZOOM
menu. The zoom cursor is displayed.
3. Move the zoom cursor to the point that is to be the center of the new
viewing window.
Summary of Contents for 83PL/CLM/1L1/V - 83 Plus Calc
Page 407: ...TI 83 Plus Inferential Statistics and Distributions 404 Input Calculated results Drawn results...
Page 412: ...TI 83 Plus Inferential Statistics and Distributions 409 Data Stats Input Calculated results...
Page 454: ...TI 83 Plus Applications 451 tvm_FV tvm_FV computes the future value tvm_FV PV PMT P Y C Y...

