TI-83 Plus
Parametric Graphing
158
Defining and Displaying Parametric Graphs
TI-83 Plus Graphing Mode Similarities
The steps for defining a parametric graph are similar to the steps for
defining a function graph. Chapter 4 assumes that you are familiar with
Chapter 3: Function Graphing. Chapter 4 details aspects of parametric
graphing that differ from function graphing.
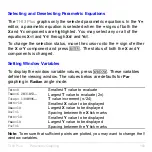
Setting Parametric Graphing Mode
To display the mode screen, press
z
. To graph parametric equations,
you must select
Par
graphing mode before you enter window variables
and before you enter the components of parametric equations.
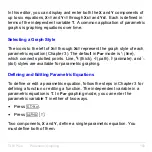
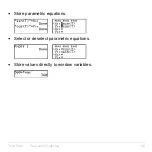
Displaying the Parametric Y= Editor
After selecting
Par
graphing mode, press
o
to display the parametric
Y=
editor.
Summary of Contents for 83PL/CLM/1L1/V - 83 Plus Calc
Page 407: ...TI 83 Plus Inferential Statistics and Distributions 404 Input Calculated results Drawn results...
Page 412: ...TI 83 Plus Inferential Statistics and Distributions 409 Data Stats Input Calculated results...
Page 454: ...TI 83 Plus Applications 451 tvm_FV tvm_FV computes the future value tvm_FV PV PMT P Y C Y...


