TI-83 Plus
Inferential Statistics and Distributions
387
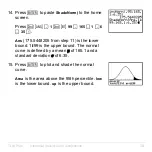
14. Press
Í
to paste
ShadeNorm(
to the home
screen.
Press
y
Z
¢
1
y
D
99
¢
165
Ë
1
¢
6
Ë
35
¤
.
Ans
(175.5448205 from step 11) is the lower
bound. 1
å
99 is the upper bound. The normal
curve is defined by a mean
µ
of 165.1 and a
standard deviation
σ
of 6.35.
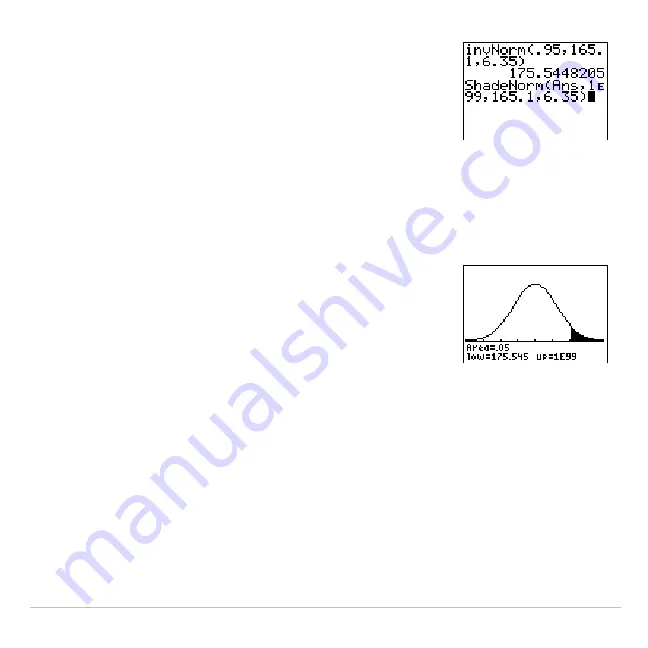
15. Press
Í
to plot and shade the normal
curve.
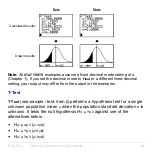
Area
is the area above the 95th percentile.
low
is the lower bound.
up
is the upper bound.
Summary of Contents for 83PL/CLM/1L1/V - 83 Plus Calc
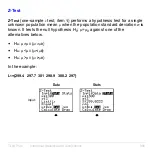
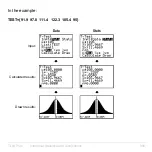
Page 407: ...TI 83 Plus Inferential Statistics and Distributions 404 Input Calculated results Drawn results...
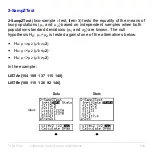
Page 412: ...TI 83 Plus Inferential Statistics and Distributions 409 Data Stats Input Calculated results...
Page 454: ...TI 83 Plus Applications 451 tvm_FV tvm_FV computes the future value tvm_FV PV PMT P Y C Y...

