TI-83 Plus
Function Graphing
130
If you performed any of these actions since the graph was last displayed,
the
TI-83 Plus
will replot the graph based on new values when you press
s
.
•
Changed a mode setting that affects graphs
•
Changed a function in the current picture
•
Selected or deselected a function or stat plot
•
Changed the value of a variable in a selected function
•
Changed a window variable or graph format setting
•
Cleared drawings by selecting
ClrDraw
•
Changed a stat plot definition
Overlaying Functions on a Graph
On the
TI-83 Plus
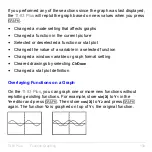
, you can graph one or more new functions without
replotting existing functions. For example, store
sin(X)
to
Y
1
in the
Y=
editor and press
s
. Then store
cos(X)
to
Y
2
and press
s
again. The function
Y
2
is graphed on top of
Y
1
, the original function.
Summary of Contents for 83PL/CLM/1L1/V - 83 Plus Calc
Page 407: ...TI 83 Plus Inferential Statistics and Distributions 404 Input Calculated results Drawn results...
Page 412: ...TI 83 Plus Inferential Statistics and Distributions 409 Data Stats Input Calculated results...
Page 454: ...TI 83 Plus Applications 451 tvm_FV tvm_FV computes the future value tvm_FV PV PMT P Y C Y...

