Chapter 17: Activities
316
•
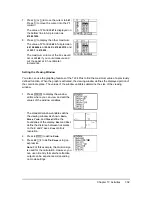
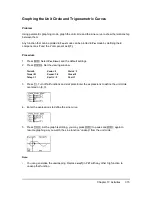
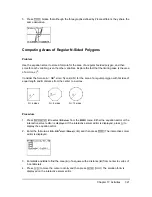
You can graph the functions again by turning the functions off and then turning them back on
on the Y= editor or by using the FuncOFF and FuncON commands on the home screen.
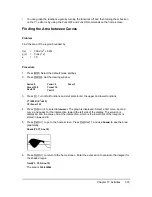
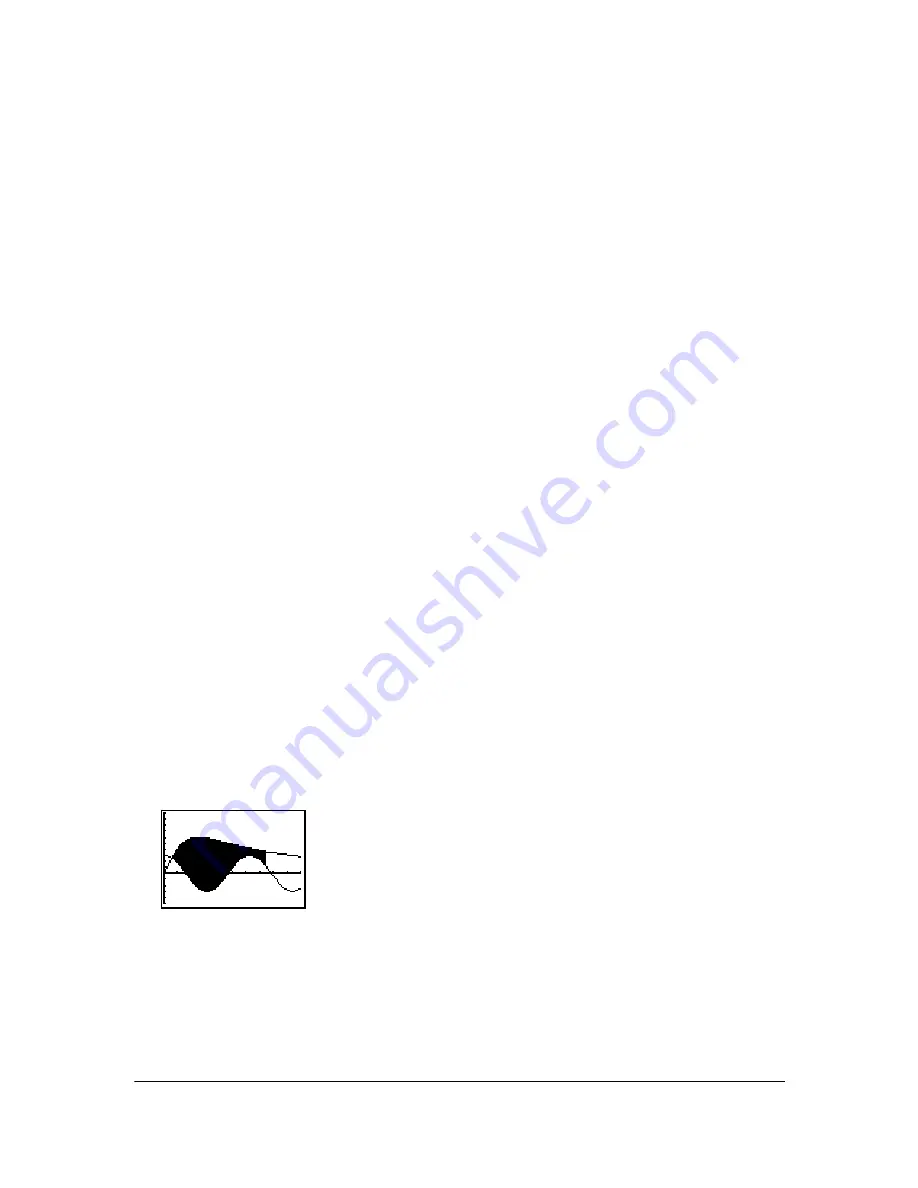
Finding the Area between Curves
Problem
Find the area of the region bounded by:
Procedure
1. Press
z
. Select the default mode settings.
2. Press
p
. Set the viewing window.
3. Press
o
. Turn off all functions and stat plots. Enter the upper and lower functions.
Y1=300X
à
(X
2
+625)
Y2=3cos(.1X)
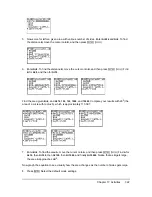
4. Press
y /
5
to select
5:Intersect
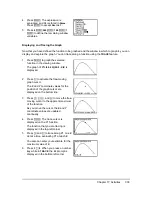
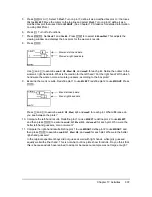
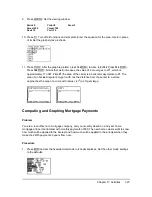
. The graph is displayed. Select a first curve, second
curve, and guess for the intersection toward the left side of the display. The solution is
displayed, and the value of
X
at the intersection, which is the lower limit of the integral, is
stored in
Ans
and
X
.
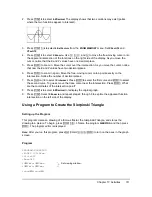
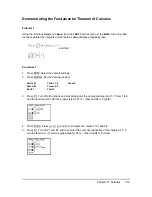
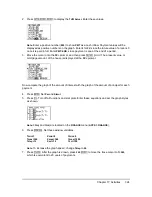
5. Press
y 5
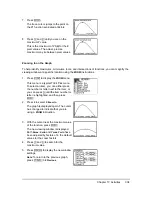
to go to the home screen. Press
y <
7
and use
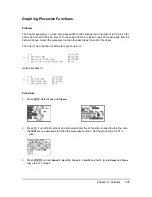
Shade(
to see the area
graphically.
Shade(Y2,Y1,Ans,75)
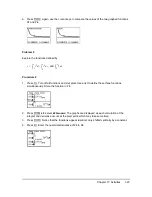
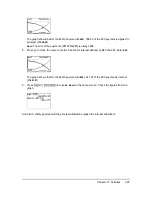
6. Press
y 5
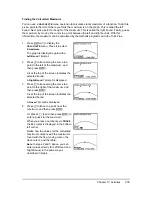
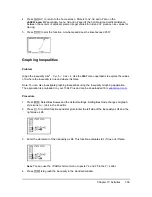
to return to the home screen. Enter the expression to evaluate the integral for
the shaded region.
fnInt(Y1
N
Y2,X,Ans,75)
The area is
325.839962
.
f(x)
g(x)
x
=
=
=
300x / (x
2
+ 625)
3cos(.1x)
75
Xmin=0
Xmax=100
Xscl=10
Ymin=
L
5
Ymax=10
Yscl=1
Xres=1

