Chapter 7: Tables
118
Displaying the Table
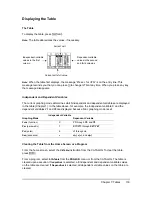
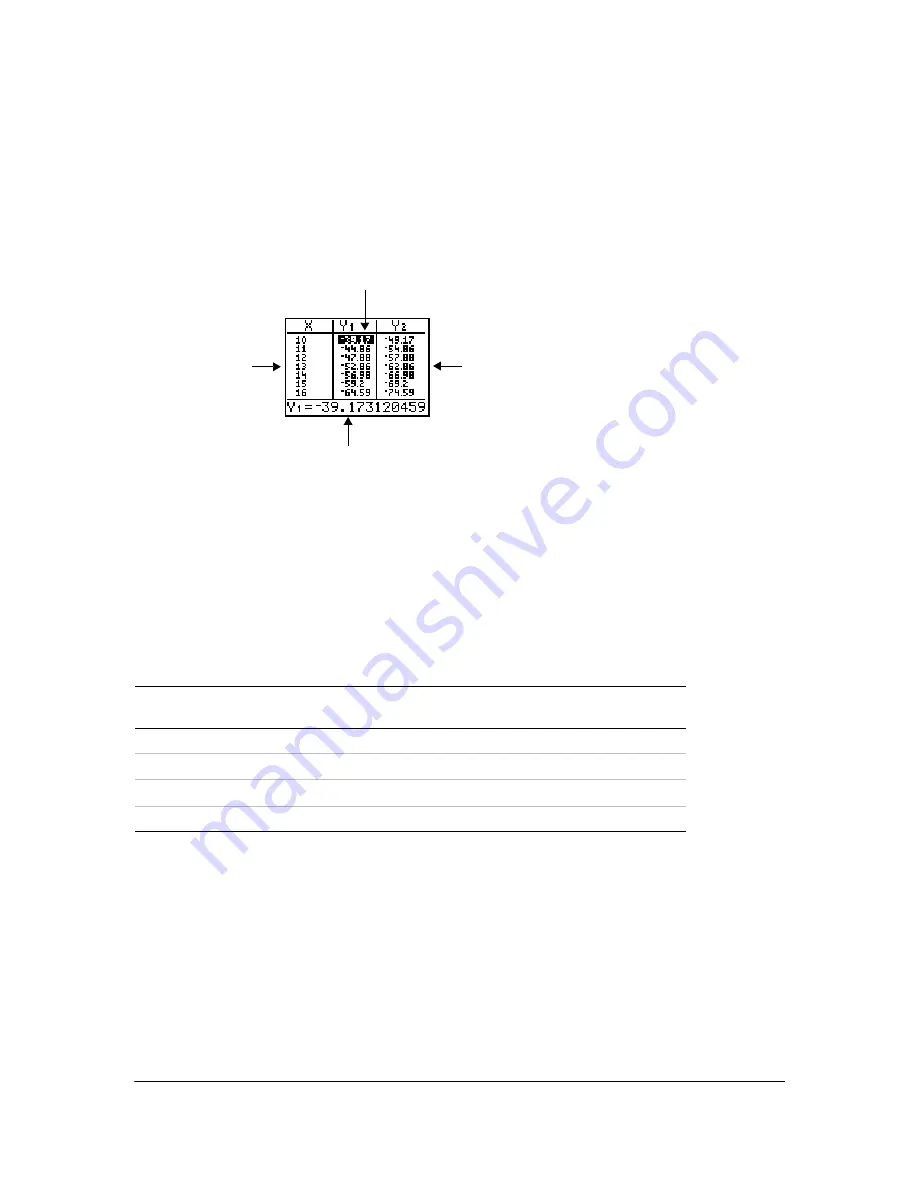
The Table
To display the table, press
y 0
.
Note:
The table abbreviates the values, if necessary.
Current cell
Current cell’s full value
Dependent-variable
values in the second
and third columns
Independent-variable
values in the first
column
Note
: When the table first displays, the message “Press + for
@
Tbl” is on the entry line. This
message reminds you that you can press
Ã
to change
@
Tbl at any time. When you press any key,
the message disappears.
Independent and Dependent Variables
The current graphing mode determines which independent and dependent variables are displayed
in the table (Chapter 1). In the table above, for example, the independent variable X and the
dependent variables
Y1
and
Y2
are displayed because Func graphing mode is set.
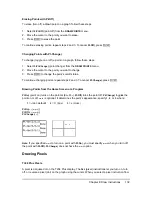
Clearing the Table from the Home Screen or a Program
From the home screen, select the
ClrTable
instruction from the CATALOG. To clear the table,
press
Í
.
From a program, select
9:ClrTable
from the
PRGM I/O
menu or from the CATALOG. The table is
cleared upon execution. If
IndpntAsk
is selected, all independent and dependent variable values
on the table are cleared. If
DependAsk
is selected, all dependent variable values on the table are
cleared.
Graphing Mode
Independent Variable
Dependent Variable
Func
(function)
X
Y1
through
Y9
, and
Y0
Par
(parametric)
T
X1T/Y1T
through
X6T/Y6T
Pol
(polar)
q
r1
through
r6
Seq
(sequence)
n
u(
n
)
,
v(
n
)
, and
w(
n
)

