Chapter 9: Split Screen
141
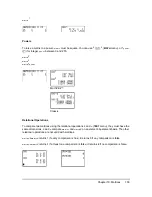
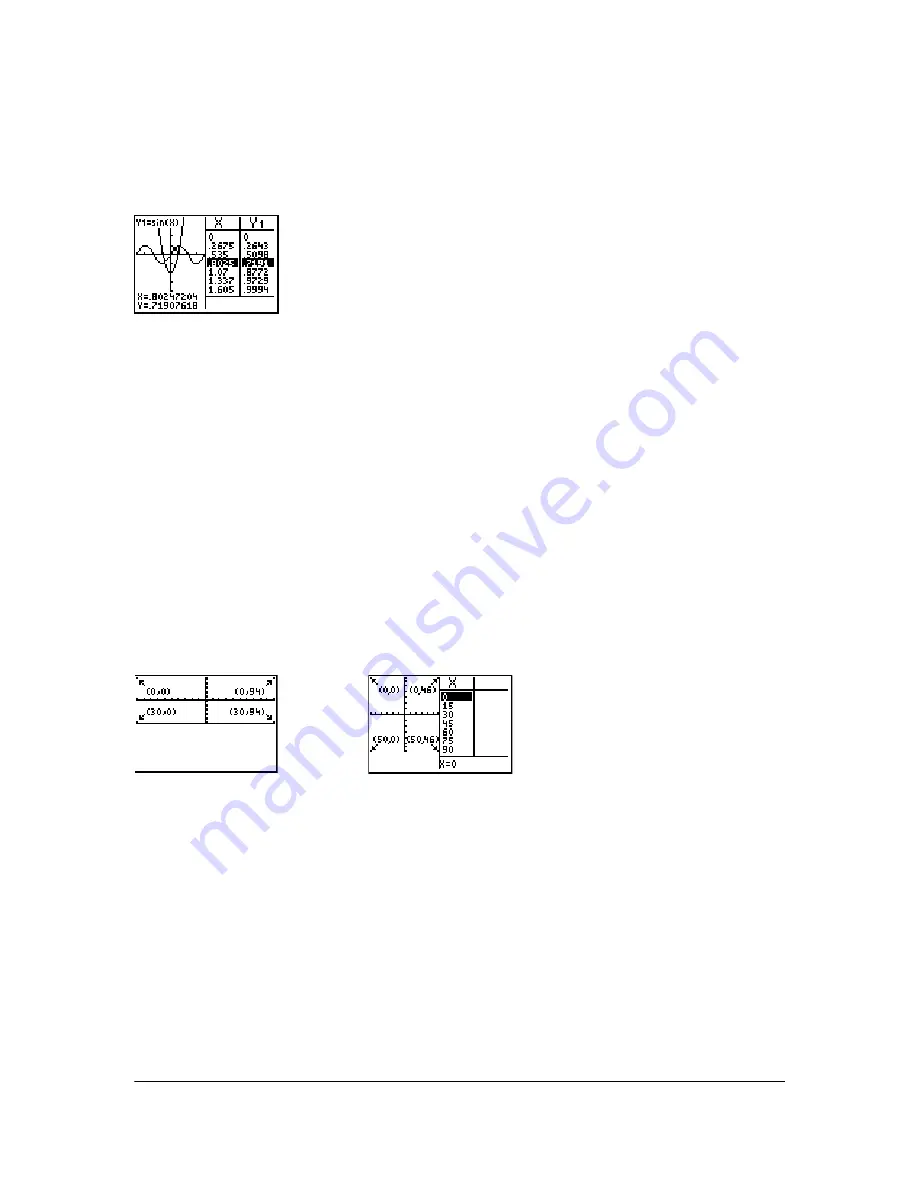
Using TRACE in G-T Mode
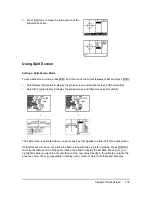
As you press
|
or
~
to move the trace cursor along a graph in the split screen’s left half in
G-T
mode, the table on the right half automatically scrolls to match the current cursor values. If more
than one graph or plot is active, you can press
}
or
†
to select a different graph or plot.
Note:
When you trace in
Par
graphing mode, both components of an equation (
X
n
T
and
Y
n
T
) are
displayed in the two columns of the table. As you trace, the current value of the independent
variable
T
is displayed on the graph.
Full Screens in G-T Mode
All screens other than the graph and the table are displayed as full screens in
G-T
split-screen
mode.
To return to the
G-T
split screen from a full screen when in
G-T
mode, press any key or key
combination that displays the graph or the table.
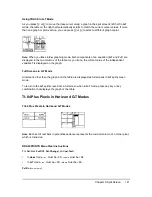
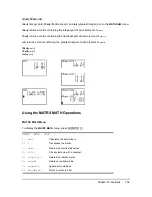
TI-84 Plus Pixels in Horiz and G-T Modes
TI-84 Plus Pixels in Horiz and G-T Modes
Note:
Each set of numbers in parentheses above represents the row and column of a corner pixel,
which is turned on.
DRAW POINTS Menu Pixel Instructions
For
Pxl-On(
,
Pxl-Off(
,
Pxl-Change(
, and
pxl-Test(
:
•
In
Horiz
mode,
row
must be
{
30;
column
must be
{
94.
•
In
G-T
mode,
row
must be
{
50;
column
must be
{
46.
Pxl-On(
row
,
column
)

