

Chapter 2: Math, Angle, and Test Operations
54
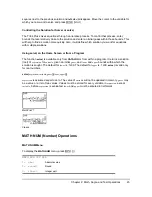
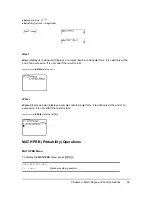
MATH CPX (Complex) Operations
MATH CPX Menu
To display the
MATH CPX
menu, press
~ ~
.
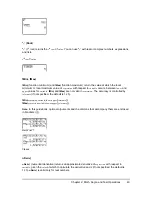
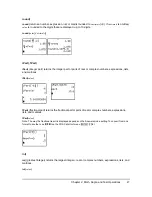
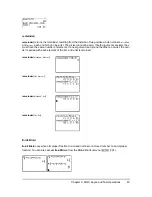
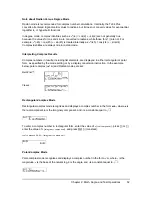
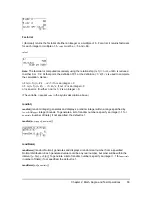
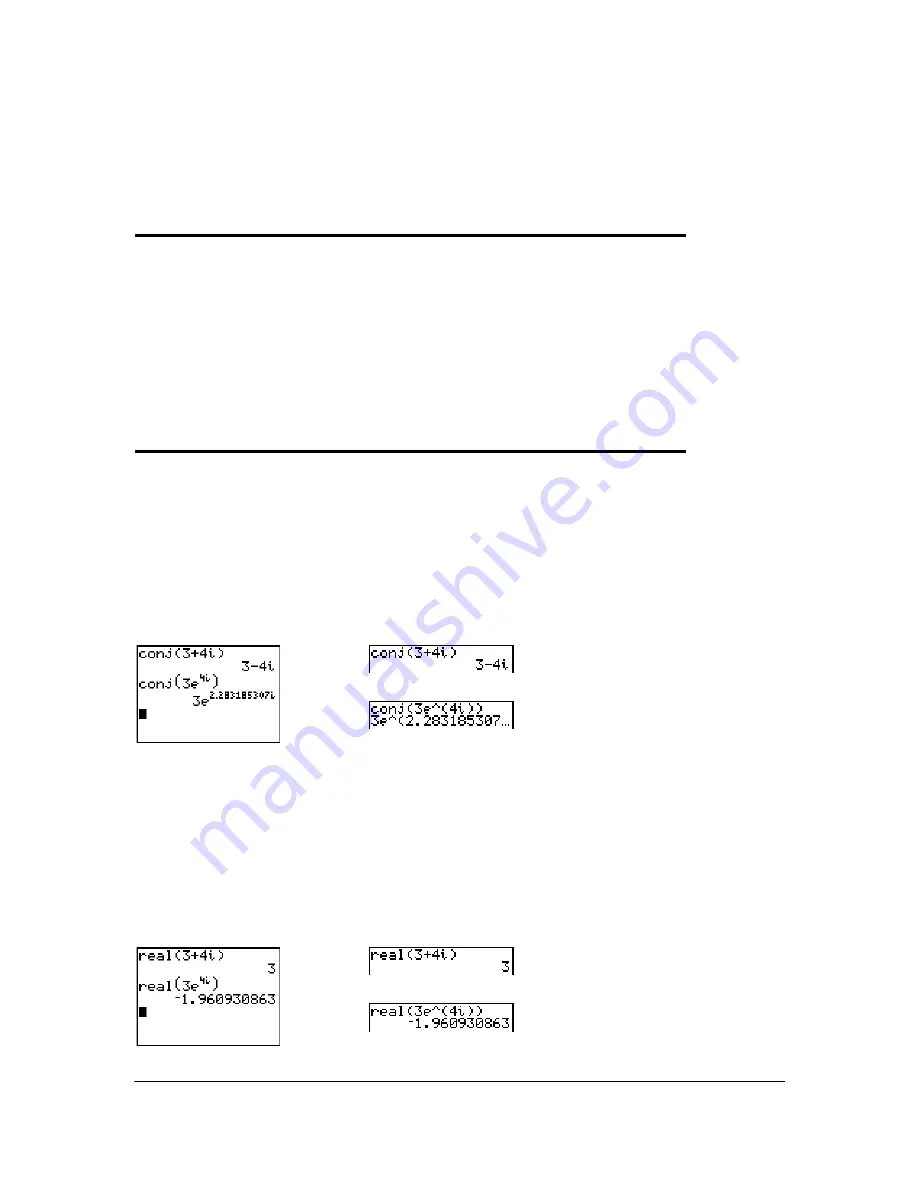
conj(
conj(
(conjugate) returns the complex conjugate of a complex number or list of complex numbers.
conj(
a
+
bi
)
returns
a
N
bi
in
a+b
i
mode.
conj(
r
e^(
q
i
))
returns
r
e^(
Lq
i
)
in
re^
q
i
mode.
MathPrint™
Classic
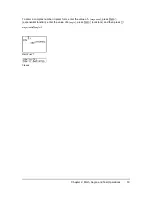
real(
real(
(real part) returns the real part of a complex number or list of complex numbers.
real(
a
+
bi
)
returns
a
.
real(
r
e^(
q
i
))
returns
r
†
cos
(
q
).
MathPrint™
Classic
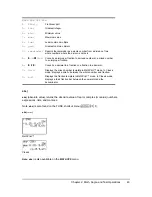
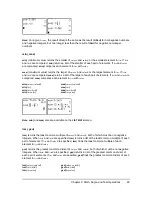
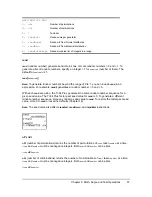
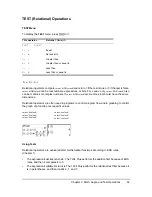
MATH NUM CPX PRB
1:
conj(
Returns the complex conjugate.
2:
real(
Returns the real part.
3:
imag(
Returns the imaginary part.
4:
angle(
Returns the polar angle.
5:
abs(
Returns the magnitude (modulus).
6:
4
Rect
Displays the result in rectangular form.
7:
4
Polar
Displays the result in polar form.


