© 2000, 2003 T
EXAS
I
NSTRUMENTS
I
NCORPORATED
G
ETTING
S
TARTED WITH THE
CBL 2™ S
YSTEM
45
Student Data Reporting Sheet
1.
If you connected the points on the graph, describe the general shape of the
graph.
2.
Use
|
and
~
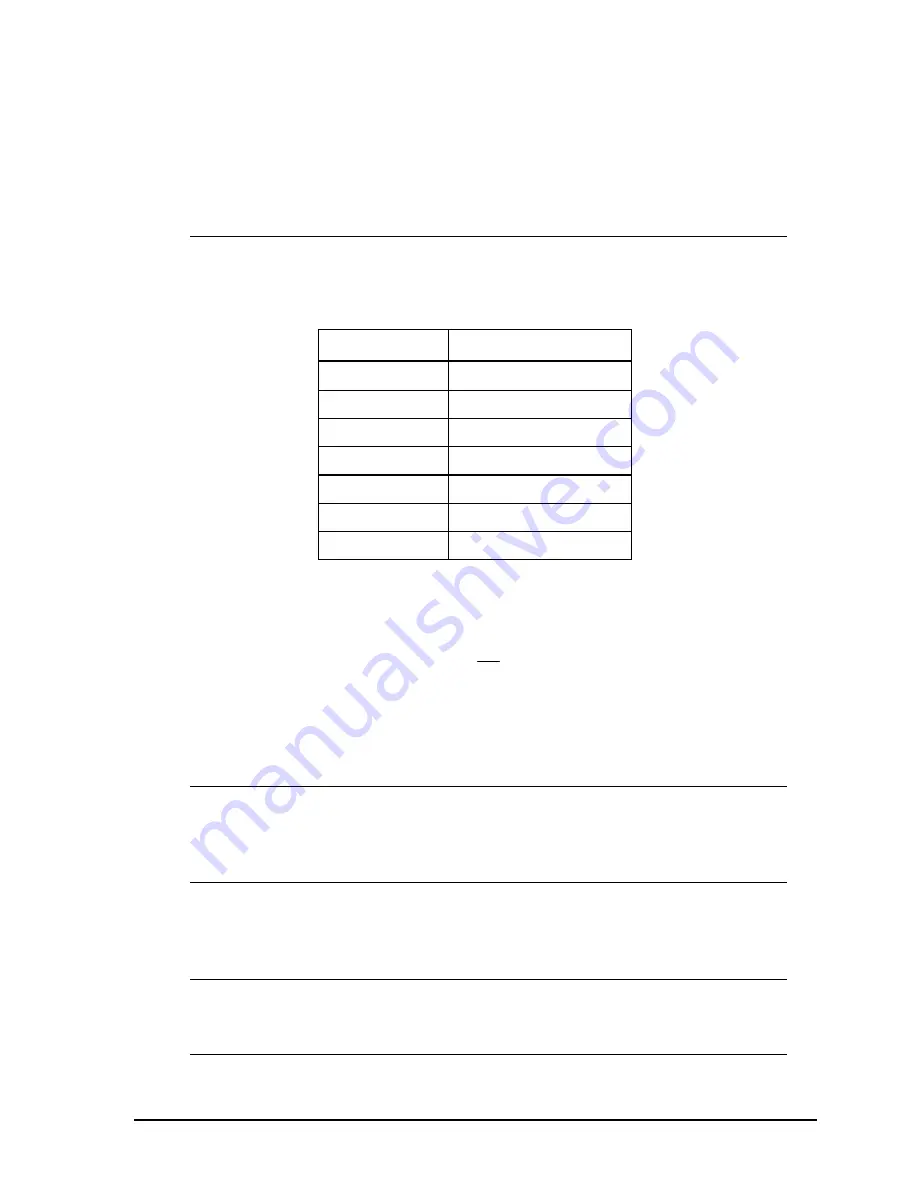
to determine the measurements from the graph, and record these
measurements in the table below:
Distance
Light Intensity
3.
Theoretically the relationship between light intensity and distance is given by a
function of the form
2
d
A
I
=
where
I
is the intensity of the light and
d
is the distance from the tip of the light
probe to the light bulb. If this is correct, what would you expect the ratio to be
between the light intensity measurements made at .5 meter and 1 meter?
What would you expect the ratio to be between the light intensity
measurements made at 1 meter and 2 meters?
What would you expect the ratio to be between the light intensity
measurements made at 1.5 meters and 3 meters?
4.
Compare the ratios from the actual data to your predictions above.


