Getting Started with TI InterActive! 43
TII_GettingStarted.doc Getting Started with TI InterActive! Karen Davis Revised: 6/15/04 2:00 PM Printed: 6/15/04 3:39 PM Page 43 of 63
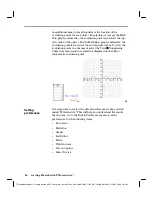
4. Make sure that the Stat Plots tab is selected. In the
uppermost text box, type
FeetperSecond
to specify it as the
list containing the x coordinates.
5. Press the Tab key to move to the second text box, and type
TotalDistance
to specify it as the list containing the y
coordinates.
6. Press Enter on the computer keyboard.
7. Click the Zoom Statistics button
in the Graph window to
adjust the viewing boundaries.
8. Click the Save To Document button
to close the Graph
window and insert the graph in the document.
1. With the cursor positioned at the end of the graph, press
Enter on the computer keyboard, type the heading
Stat
regression results:
, and then press Enter again.
2. Click the Stat Calculation button
on the TI InterActive!
toolbar. The Statistics Calculation tool is displayed.
3. Click the down arrow
next to Calculation Type, scroll
down through the list, and click Power Regression.
4. In the text box labeled X List, type
FeetperSecond
.
5. In the text box labeled Y List, type
TotalDistance
.
Calculating a
regression on
the data


