302
Using Question in the Teacher Software
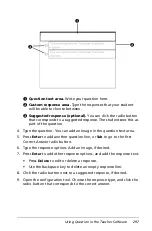
7. Open the configuration tool to set the number of points, enter a
correct answer, and add a graph preview, if desired.
•
The number of points can range from 1 to 5.
•
You can add additional fields for multiple correct answers. You
can type any combination of text and math expressions in the
correct answer fields.
•
Click the Utilities button
to open the Templates and Symbols
Palette that allows you to enter 2D math expressions.
•
To add a graph in the Question area, check the box to
Include a
Graph Preview
. The Question text area splits to show a graph on
the right.
•
When you are in the graph, the Graphs & Geometry toolbar is
available to allow you to add functions.
Note:
Only the teacher can manipulate the graph. Students can
only view and zoom the graph.
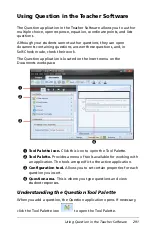
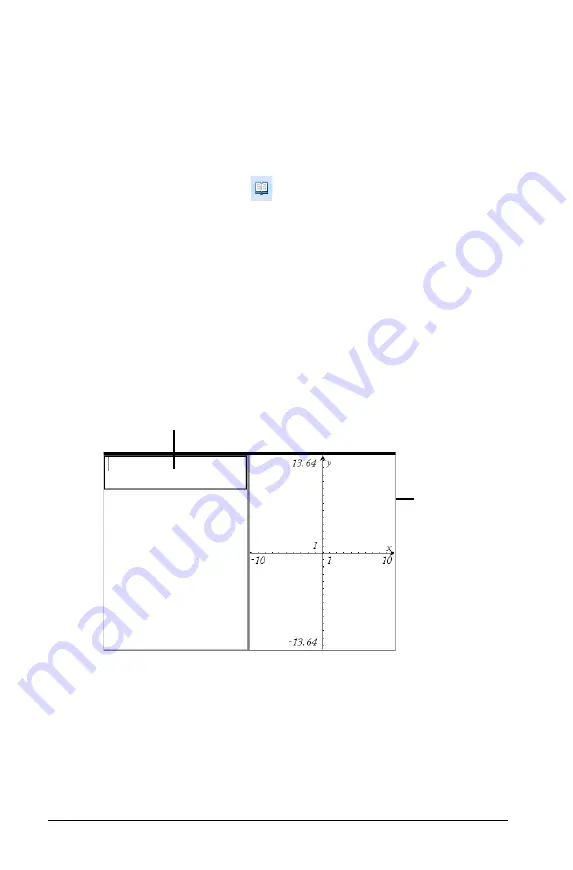
Adding a drop points question
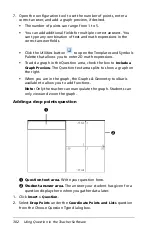
À
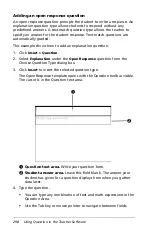
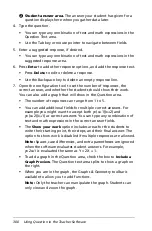
Question text area.
Write your question here.
Á
Student answer area.
The answer your student has given for a
question displays here when you gather data later.
1. Click
Insert > Question
.
2. Select
Drop Points
under the
Coordinate Points and Lists
question
from the Choose Question Type dialog box.
À
Á
Summary of Contents for TI-Nspire
Page 38: ...26 Setting up the TI Nspire Navigator Teacher Software ...
Page 46: ...34 Getting started with the TI Nspire Navigator Teacher Software ...
Page 84: ...72 Using the Content Workspace ...
Page 180: ...168 Capturing Screens ...
Page 256: ...244 Embedding documents in web pages ...
Page 336: ...324 Polling students ...
Page 374: ...362 Using the Review Workspace ...
Page 436: ...424 Calculator ...
Page 450: ...438 Using Variables ...
Page 602: ...590 Using Lists Spreadsheet ...
Page 676: ...664 Using Notes You can also change the sample size and restart the sampling ...
Page 684: ...672 Libraries ...
Page 714: ...702 Programming ...
Page 828: ...816 Data Collection and Analysis ...
Page 846: ...834 Regulatory Information ...
Page 848: ...836 ...

