Graphs & Geometry
471
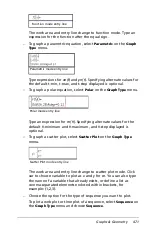
The work area and entry line change to function mode. Type an
expression for the function after the equal sign.
–
To graph a parametric equation, select
Parametric
on the
Graph
Type
menu.
Type expressions for
xn(t)
and
yn(t)
. Specifying alternate values for
the default t-min, t-max, and t-step displayed is optional.
–
To graph a polar equation, select
Polar
on the
Graph Type
menu.
Type an expression for
rn(
q
)
. Specifying alternate values for the
default
q
-minimum and
q
-maximum, and
q
-step displayed is
optional.
–
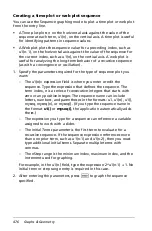
To graph a scatter plot, select
Scatter Plot
on the
Graph Type
menu.
The work area and entry line change to scatter plot mode. Click
var to choose variable to plot as
x
and
y
for
sn
. You can also type
the name of a variable that already exists, or define a list as
comma-separated elements enclosed within brackets, for
example: {1,2,3}.
–
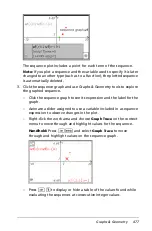
Choose the option for the type of sequence you want to plot.
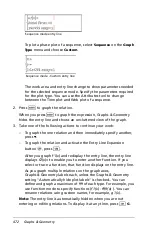
To plot a web plot or time plot of a sequence, select
Sequence
on
the
Graph Type
menu and choose
Sequence
.
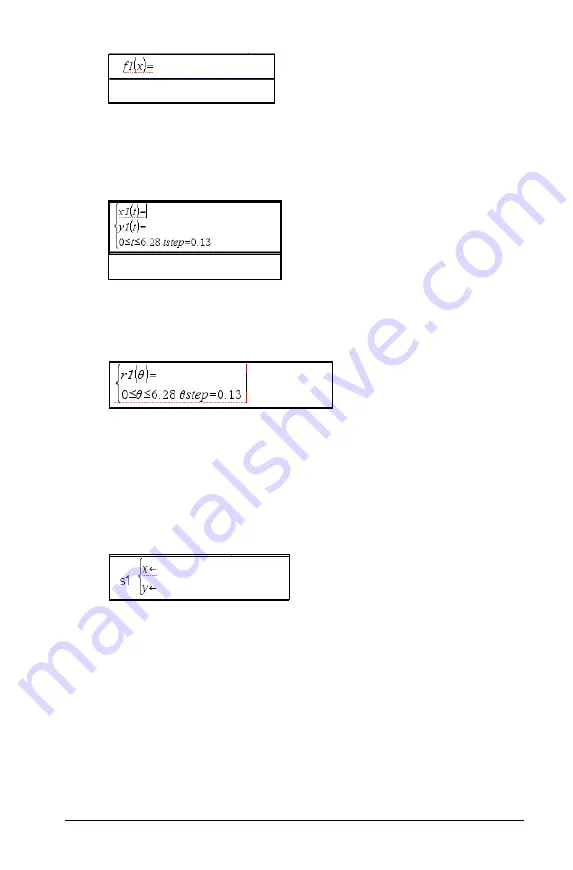
Function mode entry line
Parametric mode entry line
Polar mode entry line
Scatter Plot mode entry line
Summary of Contents for TI-Nspire
Page 38: ...26 Setting up the TI Nspire Navigator Teacher Software ...
Page 46: ...34 Getting started with the TI Nspire Navigator Teacher Software ...
Page 84: ...72 Using the Content Workspace ...
Page 180: ...168 Capturing Screens ...
Page 256: ...244 Embedding documents in web pages ...
Page 336: ...324 Polling students ...
Page 374: ...362 Using the Review Workspace ...
Page 436: ...424 Calculator ...
Page 450: ...438 Using Variables ...
Page 602: ...590 Using Lists Spreadsheet ...
Page 676: ...664 Using Notes You can also change the sample size and restart the sampling ...
Page 684: ...672 Libraries ...
Page 714: ...702 Programming ...
Page 828: ...816 Data Collection and Analysis ...
Page 846: ...834 Regulatory Information ...
Page 848: ...836 ...

