Graphs & Geometry
475
Graphing a family of functions
A family of functions differ by one or more parameters and can be
specified with a single expression. To graph a family of functions:
1. Type an expression for a family of functions on the entry line. To
specify a family of functions:
–
Specify the parameters as one expression for multiple functions
using the format
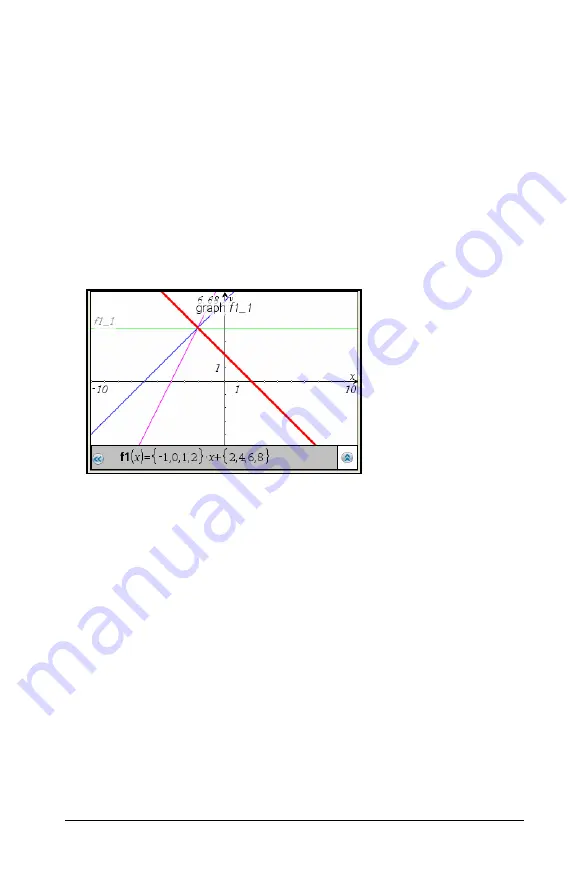
f1(x) = {-1,0,1,2} * x + {2,4,6,8}
or
f1(x) = m*x | m = {1,2,3}.
–
Enclose the lists of numbers or lists of variables in curly brackets.
Specify parameters to graph a family of up to 16 functions.
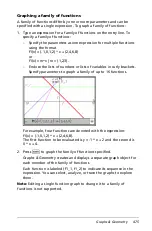
For example, four functions are denoted with the expression:
f1(x) = {-1,0,1,2} * x + {2,4,6,8}.
The first function to be evaluated is y = -1 * x + 2 and the second is
0 * x + 4.
2. Press
·
to graph the family of functions specified.
Graphs & Geometry creates and displays a separate graph object for
each member of the family of functions.
Each function is labeled (f1_1, f1_2) to indicate its sequence in the
expression. You can select, analyze, or trace the graphs to explore
them.
Note:
Editing a single function graph to change it to a family of
functions is not supported.
Summary of Contents for TI-Nspire
Page 38: ...26 Setting up the TI Nspire Navigator Teacher Software ...
Page 46: ...34 Getting started with the TI Nspire Navigator Teacher Software ...
Page 84: ...72 Using the Content Workspace ...
Page 180: ...168 Capturing Screens ...
Page 256: ...244 Embedding documents in web pages ...
Page 336: ...324 Polling students ...
Page 374: ...362 Using the Review Workspace ...
Page 436: ...424 Calculator ...
Page 450: ...438 Using Variables ...
Page 602: ...590 Using Lists Spreadsheet ...
Page 676: ...664 Using Notes You can also change the sample size and restart the sampling ...
Page 684: ...672 Libraries ...
Page 714: ...702 Programming ...
Page 828: ...816 Data Collection and Analysis ...
Page 846: ...834 Regulatory Information ...
Page 848: ...836 ...

