Graphs & Geometry
479
Note:
For a less cluttered view, choose
Hide/Show
on the
Actions
menu to hide the
rabbit(n)
and
fox(n)
sequences on the work area.
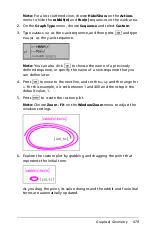
2. On the
Graph Type
menu, choose
Sequence
and select
Custom
.
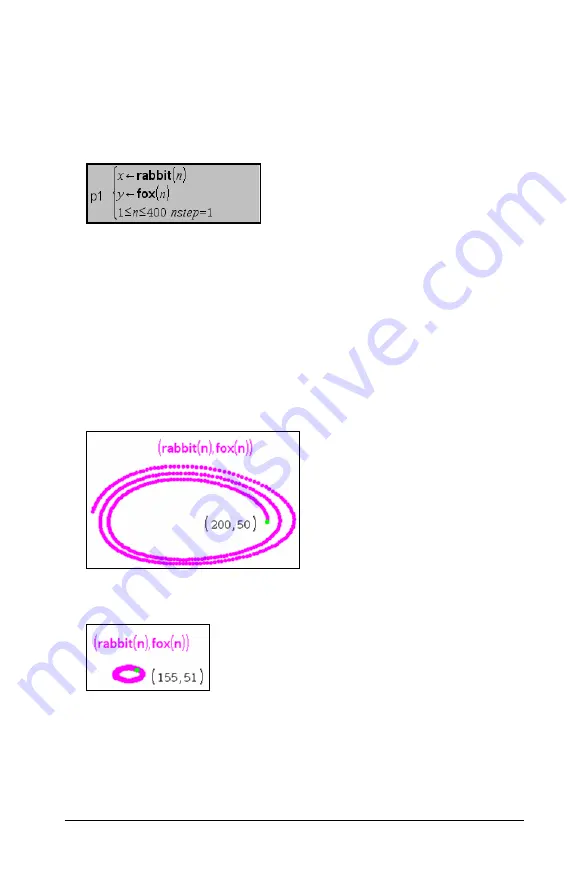
3. Type
rabbit(n)
as the x-axis sequence, and then press
e
and type
fox(n)
as the y-axis sequence.
Note:
You can also click
h
to choose the name of a previously
defined sequence, or specify the name of a new sequence that you
can define later.
4. Press
e
to move to the next line, and set the
nstep
and the range for
n
. For this example,
n
is set between 1 and 400 and the nstep is the
default value, 1.
5. Press
·
to create the custom plot.
Note:
Choose
Zoom - Fit
on the
Window/Zoom
menu to adjust the
window settings.
6. Explore the custom plot by grabbing and dragging the point that
represents the initial term.
As you drag the point, its value changes and the rabbit and fox initial
terms are automatically updated.
Summary of Contents for TI-Nspire
Page 38: ...26 Setting up the TI Nspire Navigator Teacher Software ...
Page 46: ...34 Getting started with the TI Nspire Navigator Teacher Software ...
Page 84: ...72 Using the Content Workspace ...
Page 180: ...168 Capturing Screens ...
Page 256: ...244 Embedding documents in web pages ...
Page 336: ...324 Polling students ...
Page 374: ...362 Using the Review Workspace ...
Page 436: ...424 Calculator ...
Page 450: ...438 Using Variables ...
Page 602: ...590 Using Lists Spreadsheet ...
Page 676: ...664 Using Notes You can also change the sample size and restart the sampling ...
Page 684: ...672 Libraries ...
Page 714: ...702 Programming ...
Page 828: ...816 Data Collection and Analysis ...
Page 846: ...834 Regulatory Information ...
Page 848: ...836 ...

