Graphs & Geometry
533
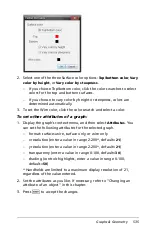
paused or stopped, display the list of attributes for each point and
change the velocity to 0.
Graphing 3D functions
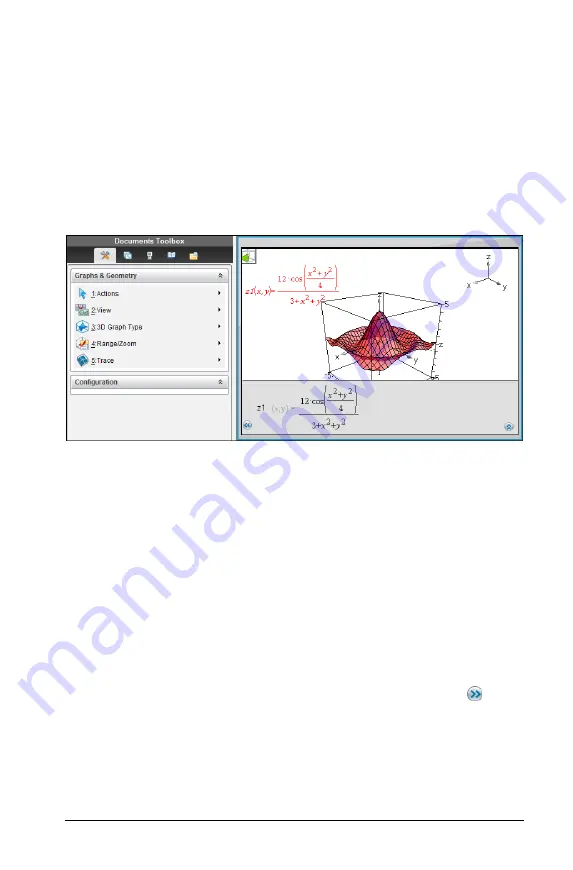
The 3D Graphing view lets you enter functions of the form z(x,y) and
view and explore them in three-dimensional space.
While you are in the 3D Graphing view, you can define, rotate, resize,
and trace 3D graphs. You can set the colors and other visual attributes of
a selected graph, and you can customize the 3D viewing environment.
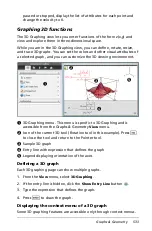
À
3D Graphing menu. This menu is specific to 3D Graphing and is
accessible from the Graphs & Geometry
View
menu.
Á
Icon of the current 3D tool (Rotation tool in this example). Press
d
to close the tool and return to the Pointer tool.
Â
Sample 3D graph
Ã
Entry line with expression that defines the graph
Ä
Legend displaying orientation of the axes
Defining a 3D graph
Each 3D graphing page can show multiple graphs.
1. From the
View
menu, select
3D Graphing
.
2. If the entry line is hidden, click the
Show Entry Line
button
.
3. Type the expression that defines the graph.
4. Press
·
to draw the graph.
Displaying the context menu of a 3D graph
Some 3D graphing features are accessible only through context menus.
À
Á
Â
Ã
Ä
Summary of Contents for TI-Nspire
Page 38: ...26 Setting up the TI Nspire Navigator Teacher Software ...
Page 46: ...34 Getting started with the TI Nspire Navigator Teacher Software ...
Page 84: ...72 Using the Content Workspace ...
Page 180: ...168 Capturing Screens ...
Page 256: ...244 Embedding documents in web pages ...
Page 336: ...324 Polling students ...
Page 374: ...362 Using the Review Workspace ...
Page 436: ...424 Calculator ...
Page 450: ...438 Using Variables ...
Page 602: ...590 Using Lists Spreadsheet ...
Page 676: ...664 Using Notes You can also change the sample size and restart the sampling ...
Page 684: ...672 Libraries ...
Page 714: ...702 Programming ...
Page 828: ...816 Data Collection and Analysis ...
Page 846: ...834 Regulatory Information ...
Page 848: ...836 ...

