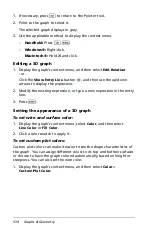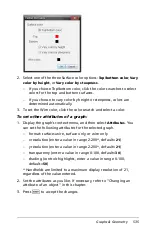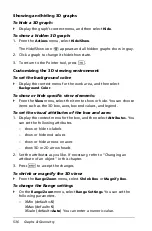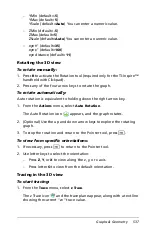
Graphs & Geometry
539
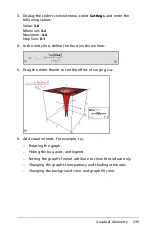
3. Display the slider’s context menu, select
Settings
, and enter the
following values.
Value:
3.8
Minimum:
3.2
Maximum:
4.4
Step Size:
0.1
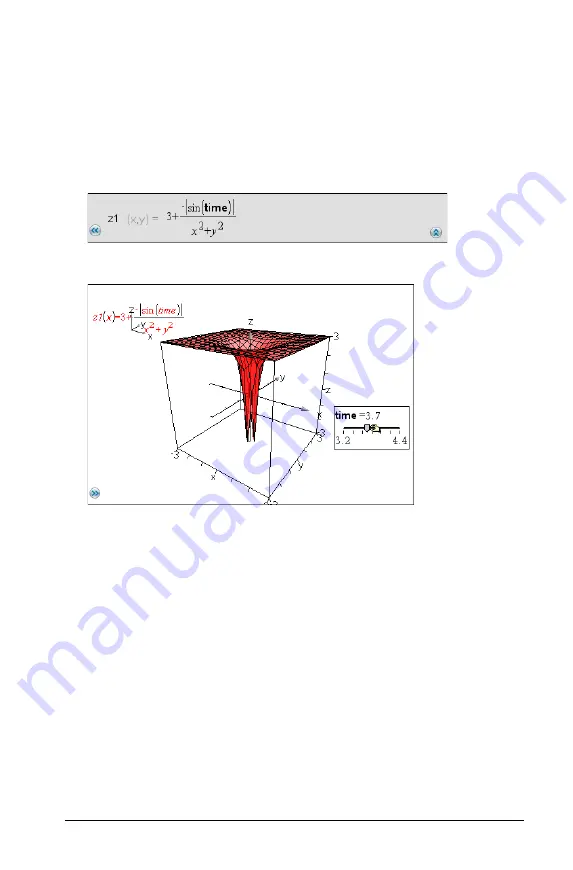
4. In the entry line, define the function shown here:
5. Drag the slider thumb to see the effect of varying
time
.
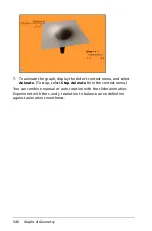
6. Add visual interest. For example, try:
–
Rotating the graph.
–
Hiding the box, axes, and legend.
–
Setting the graph’s format attribute to show the surface only.
–
Changing the graph’s transparency and shading attributes.
–
Changing the background color and graph fill color.
Summary of Contents for TI-Nspire
Page 38: ...26 Setting up the TI Nspire Navigator Teacher Software ...
Page 46: ...34 Getting started with the TI Nspire Navigator Teacher Software ...
Page 84: ...72 Using the Content Workspace ...
Page 180: ...168 Capturing Screens ...
Page 256: ...244 Embedding documents in web pages ...
Page 336: ...324 Polling students ...
Page 374: ...362 Using the Review Workspace ...
Page 436: ...424 Calculator ...
Page 450: ...438 Using Variables ...
Page 602: ...590 Using Lists Spreadsheet ...
Page 676: ...664 Using Notes You can also change the sample size and restart the sampling ...
Page 684: ...672 Libraries ...
Page 714: ...702 Programming ...
Page 828: ...816 Data Collection and Analysis ...
Page 846: ...834 Regulatory Information ...
Page 848: ...836 ...

