574
Using Lists & Spreadsheet
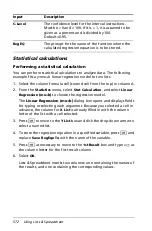
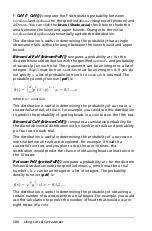
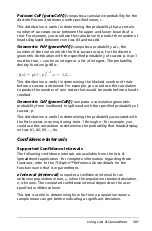
•
sum of the squared data,
•
sample standard deviation, s
•
population standard deviation,
s
•
sample size, n
•
X-min
•
first quartile, Q
1
•
median
•
third quartile, Q
3
•
X-max
•
sum of squared deviations, SSx =
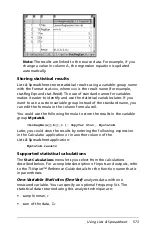
Two-Variable Statistics (TwoVar)
analyzes paired data.
List 1
is the
independent variable.
List 2
is the dependent variable. You can specify an
optional frequency list. The statistical data returned using this analysis
technique are:
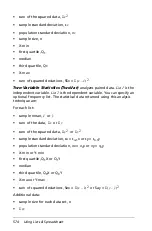
For each list:
•
sample mean, or
•
sum of the data,
or
•
sum of the squared data,
or
•
sample standard deviation, sx = s
n-1
x or sy = s
n-1
y
•
population standard deviation,
s
x =
s
n
x or
s
y =
s
n
y
•
X-min or Y-min
•
first quartile, Q
1
X or Q
1
Y
•
median
•
third quartile, Q
3
X or Q
3
Y
•
X-max or Y-max
•
sum of squared deviations, Sex =
or Say =
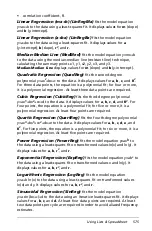
Additional data:
•
sample size for each data set, n
•
Σ
x
2
x
x
Σ
x x
–
(
)
2
x
y
Σ
x
Σ
y
Σ
x
2
Σ
y
2
Σ
x x
–
(
)
2
Σ
y y
–
(
)
2
Σ
xy
Summary of Contents for TI-Nspire
Page 38: ...26 Setting up the TI Nspire Navigator Teacher Software ...
Page 46: ...34 Getting started with the TI Nspire Navigator Teacher Software ...
Page 84: ...72 Using the Content Workspace ...
Page 180: ...168 Capturing Screens ...
Page 256: ...244 Embedding documents in web pages ...
Page 336: ...324 Polling students ...
Page 374: ...362 Using the Review Workspace ...
Page 436: ...424 Calculator ...
Page 450: ...438 Using Variables ...
Page 602: ...590 Using Lists Spreadsheet ...
Page 676: ...664 Using Notes You can also change the sample size and restart the sampling ...
Page 684: ...672 Libraries ...
Page 714: ...702 Programming ...
Page 828: ...816 Data Collection and Analysis ...
Page 846: ...834 Regulatory Information ...
Page 848: ...836 ...

