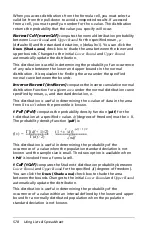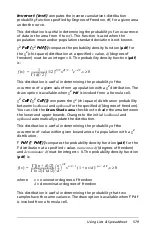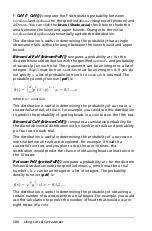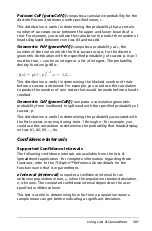
592
Using Data & Statistics
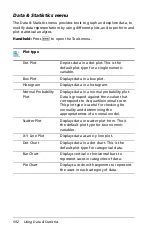
Data & Statistics menu
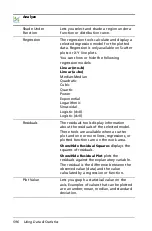
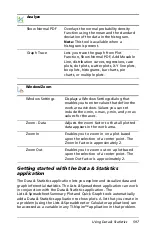
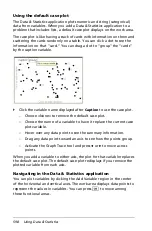
The Data & Statistics menu provides tools to graph and explore data, to
modify data representations by using different plots, and to perform and
plot statistical analyses.
Handheld:
Press
b
to open the Tools menu.
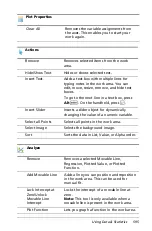
Plot type
Dot Plot
Depicts data in a dot plot. This is the
default plot type for a single numeric
variable.
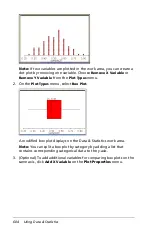
Box Plot
Displays data in a box plot.
Histogram
Displays data in a histogram.
Normal Probability
Plot
Displays data in a normal probability plot.
Data is grouped against the z-value that
corresponds to its quartile/normal score.
This plot type is useful for checking for
normality and determining the
appropriateness of a normal model.
Scatter Plot
Displays data in scatter plot form. This is
the default plot type for two numeric
variables.
X-Y Line Plot
Displays data as an x-y line plot.
Dot Chart
Displays data in a dot chart. This is the
default plot type for categorical data.
Bar Chart
Displays vertical or horizontal bars to
represent cases in categories of data.
Pie Chart
Displays a circle with segments to represent
the cases in each category of data.
Summary of Contents for TI-Nspire
Page 38: ...26 Setting up the TI Nspire Navigator Teacher Software ...
Page 46: ...34 Getting started with the TI Nspire Navigator Teacher Software ...
Page 84: ...72 Using the Content Workspace ...
Page 180: ...168 Capturing Screens ...
Page 256: ...244 Embedding documents in web pages ...
Page 336: ...324 Polling students ...
Page 374: ...362 Using the Review Workspace ...
Page 436: ...424 Calculator ...
Page 450: ...438 Using Variables ...
Page 602: ...590 Using Lists Spreadsheet ...
Page 676: ...664 Using Notes You can also change the sample size and restart the sampling ...
Page 684: ...672 Libraries ...
Page 714: ...702 Programming ...
Page 828: ...816 Data Collection and Analysis ...
Page 846: ...834 Regulatory Information ...
Page 848: ...836 ...

