596
Using Data & Statistics
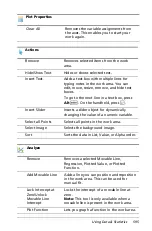
Shade Under
Function
Lets you select and shade a region under a
function or distribution curve.
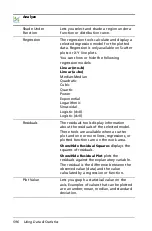
Regression
The regression tools calculate and display a
selected regression model for the plotted
data. Regression is only available on Scatter
plots or X-Y line plots.
You can show or hide the following
regression models:
Linear (mx+b)
Linear (a+bx)
Median-Median
Quadratic
Cubic
Quartic
Power
Exponential
Logarithmic
Sinusoidal
Logistic (d=0)
Logistic (d
ƒ
0)
Residuals
The residuals tools display information
about the residuals of the selected model.
These tools are available when a scatter
plot and one or more lines, regressions, or
plotted functions are on the work area.
Show/Hide Residual Squares
displays the
squares of residuals.
Show/Hide Residual Plot
plots the
residuals against the explanatory variable.
The residual is the difference between the
observed value (data) and the value
calculated by a regression or function.
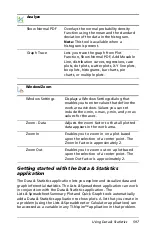
Plot Value
Lets you graph a statistical value on the
axis. Examples of values that can be plotted
are a number, mean, median, and standard
deviation.
Analyze
Summary of Contents for TI-Nspire
Page 38: ...26 Setting up the TI Nspire Navigator Teacher Software ...
Page 46: ...34 Getting started with the TI Nspire Navigator Teacher Software ...
Page 84: ...72 Using the Content Workspace ...
Page 180: ...168 Capturing Screens ...
Page 256: ...244 Embedding documents in web pages ...
Page 336: ...324 Polling students ...
Page 374: ...362 Using the Review Workspace ...
Page 436: ...424 Calculator ...
Page 450: ...438 Using Variables ...
Page 602: ...590 Using Lists Spreadsheet ...
Page 676: ...664 Using Notes You can also change the sample size and restart the sampling ...
Page 684: ...672 Libraries ...
Page 714: ...702 Programming ...
Page 828: ...816 Data Collection and Analysis ...
Page 846: ...834 Regulatory Information ...
Page 848: ...836 ...

