626
Using Data & Statistics
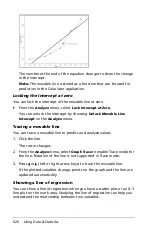
The number at the end of the equation changes to show the change
in the intercept.
Note:
The movable line is stored as a function that can be used for
prediction in the Calculator application.
Locking the intercept at zero
You can lock the intercept of the movable line at zero.
`
From the
Analyze
menu, select
Lock Intercept at Zero
.
You can unlock the intercept by choosing
Unlock Movable Line
Intercept
on the
Analyze
menu.
Tracing a movable line
You can trace a movable line to predict and analyze values.
1. Click the line.
The cursor changes.
2. From the
Analyze
menu, select
Graph Trace
to enable Trace mode for
the line. Rotation of the line is not supported in Trace mode.
3. Press
¡
or
¢
(left or right arrow keys) to trace the movable line.
If the plotted variables change, points on the graph and the line are
updated automatically.
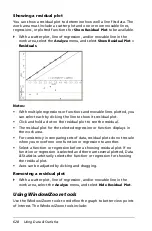
Showing a line of regression
You can show a line of regression when you have a scatter plot or an X-Y
line plot on the work area. Studying the line of regression can help you
understand the relationship between two variables.
Summary of Contents for TI-Nspire
Page 38: ...26 Setting up the TI Nspire Navigator Teacher Software ...
Page 46: ...34 Getting started with the TI Nspire Navigator Teacher Software ...
Page 84: ...72 Using the Content Workspace ...
Page 180: ...168 Capturing Screens ...
Page 256: ...244 Embedding documents in web pages ...
Page 336: ...324 Polling students ...
Page 374: ...362 Using the Review Workspace ...
Page 436: ...424 Calculator ...
Page 450: ...438 Using Variables ...
Page 602: ...590 Using Lists Spreadsheet ...
Page 676: ...664 Using Notes You can also change the sample size and restart the sampling ...
Page 684: ...672 Libraries ...
Page 714: ...702 Programming ...
Page 828: ...816 Data Collection and Analysis ...
Page 846: ...834 Regulatory Information ...
Page 848: ...836 ...

