Using Data & Statistics
635
•
Regressions
•
Case plots
•
Dot plots
•
Scatter plots and X-Y line plots
•
Box plots
•
Histograms
•
Bar charts
•
Pie charts
1. From the
Analyze
menu, select
Graph Trace
.
2. Press
¡
or
¢
to move across the plot.
The data representations enlarge and display with a bold outline as
you move across them in Trace mode.
Customizing your workspace
Working with color
All data points for a plotted variable display in the same color to
distinguish them from the data points of other variables. Data plotted by
category and split plots automatically display in different colors to help
you distinguish the data.
To emphasize or distinguish certain parts of your work, you can change
the default color for a variable’s data.
•
Apply fill colors to objects, such as shading, or change the color for a
variable’s data points.
•
Apply color to plotted lines (such as lines of regression) or movable
lines.
TI-Nspire™ handhelds without color show color objects in shades of gray.
The color information is preserved in the document unless you change
color from the handheld. If you choose to, you can work in grayscale
mode to view objects in the desktop software similarly to how they
appear on the handheld.
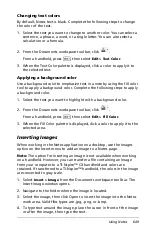
Inserting a background image
When using the computer software, you can insert an image as a
background for a Data & Statistics page. The file format of the image can
be .bmp, .jpg, or .png.
1. From the
Insert
menu, select
Image
.
Summary of Contents for TI-Nspire
Page 38: ...26 Setting up the TI Nspire Navigator Teacher Software ...
Page 46: ...34 Getting started with the TI Nspire Navigator Teacher Software ...
Page 84: ...72 Using the Content Workspace ...
Page 180: ...168 Capturing Screens ...
Page 256: ...244 Embedding documents in web pages ...
Page 336: ...324 Polling students ...
Page 374: ...362 Using the Review Workspace ...
Page 436: ...424 Calculator ...
Page 450: ...438 Using Variables ...
Page 602: ...590 Using Lists Spreadsheet ...
Page 676: ...664 Using Notes You can also change the sample size and restart the sampling ...
Page 684: ...672 Libraries ...
Page 714: ...702 Programming ...
Page 828: ...816 Data Collection and Analysis ...
Page 846: ...834 Regulatory Information ...
Page 848: ...836 ...

