Using Notes
661
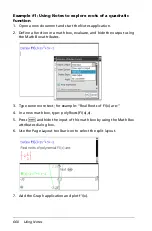
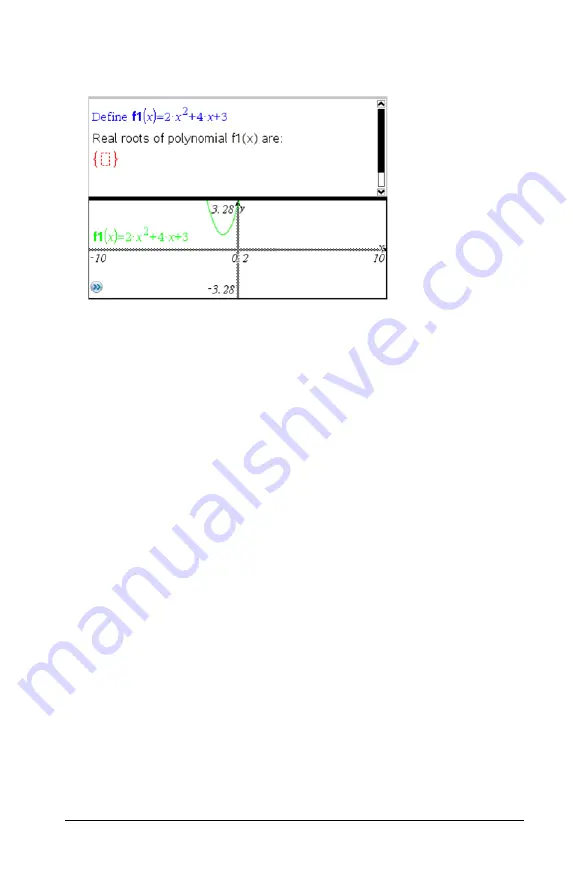
See how the roots of f1 change when the function is modified in
Graph.
Example #2: Using Notes to explore data sampling
In this example, we create a sampling distribution of sample means
drawn from a given population. We will be able to watch the sampling
distribution take shape for a given sample size and describe its
characteristics. You can change the population and the sample size.
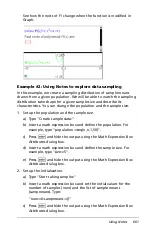
1. Set up the population and the sample size.
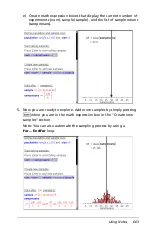
a) Type "Create sample data:"
b) Insert a math expression box and define the population. For
example, type "population:=seq(n,n,1,50)".
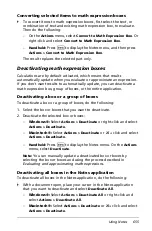
c) Press
·
and hide the output using the Math Expression Box
Attributes dialog box.
d) Insert a math expression box and define the sample size. For
example, type "size:=5".
e) Press
·
and hide the output using the Math Expression Box
Attributes dialog box.
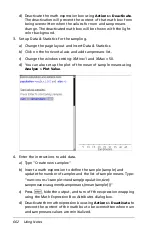
2. Set up the initialization.
a) Type "Start taking samples:"
b) Insert a math expression box and set the initial values for the
number of samples (num) and the list of sample means
(sampmeans). Type:
"num:=0:sampmeans:={}"
c) Press
·
and hide the output using the Math Expression Box
Attributes dialog box.
Summary of Contents for TI-Nspire
Page 38: ...26 Setting up the TI Nspire Navigator Teacher Software ...
Page 46: ...34 Getting started with the TI Nspire Navigator Teacher Software ...
Page 84: ...72 Using the Content Workspace ...
Page 180: ...168 Capturing Screens ...
Page 256: ...244 Embedding documents in web pages ...
Page 336: ...324 Polling students ...
Page 374: ...362 Using the Review Workspace ...
Page 436: ...424 Calculator ...
Page 450: ...438 Using Variables ...
Page 602: ...590 Using Lists Spreadsheet ...
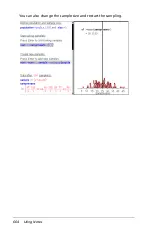
Page 676: ...664 Using Notes You can also change the sample size and restart the sampling ...
Page 684: ...672 Libraries ...
Page 714: ...702 Programming ...
Page 828: ...816 Data Collection and Analysis ...
Page 846: ...834 Regulatory Information ...
Page 848: ...836 ...

