background image

Data Collection and Analysis

785

2. Select the number of points from the drop-down menu.

3. Click 

OK

.

Drawing a predictive plot

Use this option to draw the predicted outcome of an experiment by 
adding points to your graph.

Drawing the prediction

To draw the prediction:

1. Select 

Analyze > Draw Prediction > Draw

.

2. Move your cursor over the graph, clicking at each area you want to 

place the point. 

3. Click the Esc key to release.

Handheld: Press 

d

 to release.

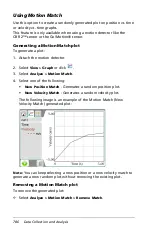
The following image is an example of a drawn prediction.

Clearing the prediction

To clear the drawn prediction:

³

Select 

Analyze > Draw Prediction > Clear

.

Summary of Contents for TI-Nspire

Page 1: ...TI Nspire Navigator Teacher Software Guidebook This guidebook applies to TI Nspire software version 3 0 To obtain the latest version of the documentation go to education ti com guides ...

Page 2: ...arising out of the purchase or use of these materials and the sole and exclusive liability of Texas Instruments regardless of the form of action shall not exceed the amount set forth in the license for the program Moreover Texas Instruments shall not be liable for any claim of any kind whatsoever against the use of these materials by any other party License Please see the complete license installe...

Page 3: ...d with the TI Nspire Navigator Teacher Software 27 Exploring the TI Nspire Navigator Teacher software 29 Exploring workspaces 31 Changing language 31 Using help 32 Using the Content Workspace 35 Exploring the Resources pane 37 Exploring the Content pane 38 Working with Links 41 Using Web Content 44 Working with connected handhelds 48 Working with lesson bundles 53 Sending files to a class 61 Under...

Page 4: ...127 Working with applications 128 Selecting and moving pages with the Page Sorter 132 Working with problems and pages 134 Using Utilities in documents 136 Using colors in documents 140 Using Screen Capture 141 Printing documents 143 Viewing document properties and copyright information 144 Capturing Screens 147 Accessing Screen Capture 147 Using Capture Class 148 Setting Teacher Preferences for Ca...

Page 5: ...king with images 212 Working with video files 214 Converting documents 216 Printing PublishView documents 219 Embedding documents in web pages 221 Using embedded web pages 221 Viewing embedded web pages 221 Using TI Nspire HTML Inline Frames 222 Using dynamically generated iframes 225 Using the TI Nspire Document Player 226 Exporting to a web page 226 Customizing an embedded TI Nspire Document Pla...

Page 6: ...setting student passwords 271 Using menus and toolbar icons 273 Using Live Presenter 281 Before starting Live Presenter 281 Starting Live Presenter 281 Exploring Live Presenter mode 282 Hiding and showing student names 284 Hiding and showing the presenter handheld 285 Viewing Keypress History 286 Showing the handheld screen only 288 Recording the live presentation 289 Stopping Live Presenter 290 U...

Page 7: ...pace 363 Exploring the Assignments pane 364 Exploring the Workspace views 365 Saving an item to the Portfolio workspace 367 Importing an item to Portfolio 368 Editing scores 369 Exporting results 371 Sorting information in Portfolio 371 Opening a Portfolio item in another workspace 372 Opening a Master Document 373 Adding a Master Document 373 Redistributing a Portfolio item 374 Collecting missing...

Page 8: ...alues on pages 425 Creating variables 425 Using linking variables 431 Naming variables 433 Locking and unlocking variables 435 Graphs Geometry 439 Getting started with Graphs Geometry 439 Graphs Geometry menu 440 Using keystroke shortcuts 450 Using the context menu 451 Using the work area 452 Graphs Geometry views 460 Using the Graphing View 461 Customizing the work area 462 Adjusting variable val...

Page 9: ... numeric plot types 602 Working with categorical plot types 611 Exploring data 619 Using Window Zoom tools 628 Graphing Functions 629 Using Graph Trace 634 Customizing your workspace 635 Adjusting variable values with a slider 636 Inferential Statistics 640 Using Notes 643 Getting started with the Notes application 643 Using templates 645 Formatting text in Notes 647 Using color in Notes 648 Inser...

Page 10: ...lacing text 683 Closing the current function or program 684 Running programs and evaluating functions 684 Getting values into a program 687 Displaying information 689 Using local variables 690 Differences between functions and programs 691 Calling one program from another 692 Controlling the flow of a function or program 694 Using If Lbl and Goto to control program flow 694 Using loops to repeat a...

Page 11: ...5 Selecting an independent variable column 758 Selecting a dependent variable column 758 Working with data and Table View 759 Defining column options 759 Changing a data set name 762 Adding a new manual column 763 Adding a calculated column 764 Creating a new data set 767 Using advanced data collection options 767 Setting up an offline sensor 767 Selecting a remote collection unit 768 Collecting r...

Page 12: ...n 819 Working with the emulated handheld 820 Using the Touchpad 821 Using the Clickpad 821 Using settings and status 822 Changing TI SmartView options 822 Working with documents 823 Using Screen Capture 824 Regulatory Information 825 USA FCC Information Concerning Radio Frequency Interference 825 Canadian IC Information 827 Texas Instruments Support and Service 835 For U S and Canada 835 ...

Page 13: ...you send polls to your students receive the students responses to the polls and review the poll results with your students Screen Capture Lets you capture your students handheld screens automatically or at specific time intervals Live Presenter Lets you display work as it is being performed on your handheld screen or your students handheld screens Review and Analysis Lets you collect and review st...

Page 14: ...ools The process of unpacking the equipment setting up the hardware and installing the software will probably require about two hours of your time Unpacking the boxes The TI Nspire Navigator system product consists of TI Nspire Navigator Teacher Software an access point and either 15 or 30 cradles or wireless adapters depending on your specific order If necessary you can purchase additional kits t...

Page 15: ...tems 1 TI Navigator access point 1 AC9930 power adapter includes power supply and power cord 1 USB computer cable 1 DVD containing system software The Getting Started with the TI Nspire Navigator Teacher Software guide Access point USB cable AC9930 power adapter for the access point One DVD Getting Started guide ...

Page 16: ...rd TI Nspire Navigator Cradle Charging Bay If you purchased the TI Nspire CX Navigator System for use with the TI Nspire CX or TI Nspire CX CAS handhelds exclusively your contents include the following items Quantities will vary depending on the system you purchased TI Nspire CX Wireless Network Adapaters TI Nspire CX Wireless Network Adapter storage cases Cradle charging bay Cradles AC9940 power ...

Page 17: ...atteries by leaving them in the charging bay beyond the time needed to fully charge them Also it is not necessary to fully discharge the batteries before recharging them Make sure you have enough 3 4 power outlets for the equipment you received If necessary obtain a plug strip so that you have plenty of grounded outlets 1 Insert the small end of the AC9940 power adapter cord into the charging bay ...

Page 18: ...efore you use the TI Nspire Navigator Teacher Software with your handhelds make sure you have the latest operating system installed on all of the handhelds in order for the software to work properly You can use the TI Nspire Navigator Teacher Software to update the handheld operating system Note After you install the latest OS on one handheld you can use that handheld to install the OS on other ha...

Page 19: ...acher Software displays a dialog box asking if you want to install the OS on the handheld save it to your computer or both 6 Click Browse if you want to change the location to save the handheld operating system 7 Click Continue 8 Accept the license agreement and click Continue TI Nspire Navigator Teacher Software displays a message box warning you that any unsaved data will be lost Click Yes to co...

Page 20: ... A Network Setup wizard helps you activate the access point and wireless adapters and cradles for wireless communication If you have not used the TI Nspire Navigator Teacher Software before a prompt opens asking if you want to set up your classroom You can choose to set up your classroom or continue on to the TI Nspire Navigator computer home screen Before you begin 1 Make sure you have installed ...

Page 21: ...ccess point 1 Identify the cables 2 Connect the AC9930 power adapter to the power jack on the access point 3 Connect the USB cable to the access point 4 Make sure the access point power light is on AC9930 Power adapter USB cable USB connection Access point side view Power adapter jack ...

Page 22: ... the TI Nspire Navigator Teacher Software open TI Nspire Network Manager to set up your system To open Network Manager click Tools Network Manager A setup wizard helps you through the next steps Note You can run the setup wizard later by opening TI Nspire Network Manager and clicking Actions Network Setup Wizard 1 Confirm that the AC9930 power adapter is connected to the access point 2 Plug the AC...

Page 23: ... 5 Select your country The operating channel is automatically set to a default setting 6 Click OK TI Nspire Network Manager sends signals to the access point to add it to the network After the access point is found the wizard displays a message 7 Click OK ...

Page 24: ...elds to transfer files update the OS and other actions Note The TI Nspire Network Manager wizard automatically guides you through the process for adding wireless adapters or cradles You can automatically or manually add wireless adapters or cradles at any time by following the procedures below Adding wireless adapters or cradles automatically Before you use the auto discover feature make sure the ...

Page 25: ...ireless adapter or wireless cradle to the handheld Verify that the cradle is locked The lock on the back of the cradle is in the ON position 5 When all of the adapters and cradles are added click Finish Adding wireless adapters or cradles manually When you add a wireless adapter or cradle manually it immediately appears in the TI Nspire Network Manager window 1 Click Manually Add Wireless Client s...

Page 26: ...ters or TI Nspire Navigator Cradles from the network You might need to remove adapters or cradles because your access point has been associated with wireless clients that should belong to another classroom 1 In the TI Nspire Network Manager window select the wireless adapters and cradles that you want to remove from the network 2 Click Actions Remove Selected or click 3 Click Remove at the prompt ...

Page 27: ...the adapter into position making sure the guides on the sides of the adapter slide into the grooves on the sides of the handheld 3 Firmly press the adapter into place Guides for aligning with handheld Connector Grooves to align wireless adapter Sideview of handheld ...

Page 28: ...ire CX CAS handhelds To connect the handheld to the cradle follow these steps 1 Slide the lock on the back of the cradle to the OFF position 2 To attach the handheld face the screen upward and slide the handheld onto the top of the TI Nspire Navigator wireless cradle Be sure that both sides of the handheld are inserted into both of the side guides Lock in OFF position ...

Page 29: ...the cradle 4 Lock the handheld in place by sliding the lock on the back of the cradle to the ON position 5 Insert each cradle into the charging bay Make sure the LED is amber At the end of the school day return the wireless cradle to the charging bay and charge them overnight The cradles are charged when all the power status LEDs are solid green or amber Lock in ON position ...

Page 30: ...case in a cool dry place If you need to store the TI Nspire Navigator Cradles for more than two weeks remove the handhelds from the cradles and store the cradles in a cool dry place You cannot damage the batteries by leaving them in the charging bay beyond the time needed to fully charge them or by leaving them in the charging bay while the charging bay is unplugged Checking the status of wireless...

Page 31: ...k Manager window you can identify which ones are not responding by the Status message and you can see the serial numbers You could match the serial numbers in the window with the ones printed on the back of each wireless cradle However TI Nspire Network Manager gives you an easier way to physically locate them You can use the Identify selected command to quickly tell which cradles are working prop...

Page 32: ... TI Nspire Navigator Teacher Software Your teacher account lets you log in to the TI Nspire Navigator network from your handheld Color and pattern Meaning Blinking green Indicates data transfer to and from the access point Color and pattern Meaning In the charging bay Solid amber The battery is charging Solid green Power on charged and powered by a charging bay or power adapter Solid red The batte...

Page 33: ...view If you select this preference the teacher icon will appear in the classroom view and you will be included as a recipient in Send to Class Collect from Class and Delete from Class operations The teacher handheld screen will be included in screen captures of the class 6 Select or deselect the options to randomize the order in Screen Capture and to individualize the teacher handheld in Screen Ca...

Page 34: ... teacher s screen in the screen capture 7 Click OK Changing the password of your teacher account 1 Make sure you are not logged in to the TI Nspire Navigator network on your handheld 2 Click File Settings Teacher Preferences The Teacher Preferences dialog box opens 3 Click Reset TI Nspire Navigator software clears the current password ...

Page 35: ... 23 4 Enter a new password 5 Click OK Changing the user name of your teacher account 1 Make sure you are not logged in to the TI Nspire Navigator network on your handheld 2 Click File Settings Teacher Preferences The Teacher Preferences dialog box opens ...

Page 36: ... the TI Nspire Navigator network from your handheld For more information on using a handheld refer to the handheld guidebooks available at education ti com guides Before you log in make sure these items are ready You have created your teacher account in Teacher Preferences You have started a class session on your computer The TI Nspire handheld is ready for login The icon is blinking Before your s...

Page 37: ...less cradle or TI Navigator network The icons indicate status as follows Icon Status Meaning Blinking The handheld is searching for an access point Solid The handheld has found an access point Solid The handheld is not communicating with the adapter or cradle Unattach the handheld from the adapter or cradle wait for the icon to disappear and then reattach the handheld to the adapter or cradle Blin...

Page 38: ...26 Setting up the TI Nspire Navigator Teacher Software ...

Page 39: ...allation or you can start the software at any time by clicking the Start Programs TI Tools menu on a PC or the Applications menu on a Macintosh and then choosing the software you purchased To help you get started quickly when you open the software the Welcome Screen appears with some common task options To begin working with documents click on an icon or link or close this screen manually Any norm...

Page 40: ...pens the Content workspace where you can find content on your computer the web or connected handhelds Manage handhelds Opens the Content workspace where you can see every handheld connected to your computer as well as the status of each Transfer documents Opens the Transfer Tool application in the Content workspace where you can send documents folders or new handheld OS files to the connected hand...

Page 41: ...re Navigator Teacher software When you close the Welcome Screen the TI Nspire Navigator Teacher software is open to the last workspace you used If this is your first time using the software the Content workspace is open by default Workspaces are explained in more detail below The tools described below are available in all workspaces of the TI Nspire Navigator Teacher software For more details on o...

Page 42: ...l menu options change depending on which workspace is open Those tools are covered in their respective chapters The Quick Poll tool lets you send a poll to students that they immediately receive on their handhelds and receive student responses For more information on the Quick Poll tool see the Polling Students chapter The Capture Page tool lets you take a picture of an active document on the comp...

Page 43: ...cher software uses workspaces to help you easily access the tasks you most commonly perform The TI Nspire Navigator Teacher software has five predefined workspaces Each workspace is explained in additional detail in their respective chapters Content Workspace Find and manage content on your computer links to websites connected handhelds or Texas Instruments web content Class Workspace Manage class...

Page 44: ...lp you use the software more productively You can Open the help file Press F1 or select Help TI Nspire Navigator Teacher Software Help Activate or update the software license Manage your subscription Register your TI product Download the latest guidebooks Find information easily and quickly Learn how to perform new tasks more easily and efficiently Visit knowledge sites on the Internet to improve ...

Page 45: ... Software 33 Note Aside from viewing your current software version you must be connected to the Internet to perform any of these tasks You do not need to be connected to the Internet to view your current version of software as shown in the About command ...

Page 46: ...34 Getting started with the TI Nspire Navigator Teacher Software ...

Page 47: ...s you perform may prevent you from immediately changing workspaces If a dialog box awaits a response from you enter your response and then change workspaces  Content Workspace toolbar Shows frequently performed tasks Each of these are explained in more detail in Using menus and toolbar icons later in this chapter à Resources pane Select content here You can select from files on your computer web ...

Page 48: ...ontent you have selected in the content pane The content appearing in this pane varies depending on the item you have selected You will see the name and a description of the selected item actions you can perform and files included if applicable such as lesson bundle files Ç Status bar See additional details below Understanding the status bar The status bar gives you information about the network s...

Page 49: ...e item in the Preview pane You can add your own shortcuts in Local Content Á Links You can add your own links to this section There are also a few existing links to Texas Instrument sites Links from the latest version of the TI Nspire Navigator Teacher software are added when you upgrade Click on any link to open the link in a new browser Note You can add your own links to the Links section but yo...

Page 50: ...m in Web Content the list of activities display in the Content pane with a preview of the activity selected appearing in the Preview pane à Connected Handhelds When you select Connected Handhelds in the left pane the Content pane displays detailed information about each handheld including a name battery status for the rechargeable and AAA batteries the storage space and the OS in use Error message...

Page 51: ...down menu to access options for working with files and folders Á Look in field Contains the path and name of the current folder and file Click to view a history of accessed folders  Click to move up a level in the folder hierarchy à Click to create a new folder The new folder is added to the list Type a name for the folder and and press Enter Ä Search Enter a search keyword or phrase and press En...

Page 52: ...o preview the next page The backward arrow becomes active so you can move backward through the pages If working with a lesson bundle you can choose to preview a TI Nspire document within the bundle  If a lesson bundle is selected the Files window appears above the Details window listing the files in the lesson bundle You can double click a file to open it à If a folder is selected the Details win...

Page 53: ...quently used files 2 Click then select Create Shortcuts The folder is added to the list of folders under the Local Content heading in the Resources pane Deleting a shortcut To delete a shortcut 1 From the Local Content list select the folder to be deleted 2 Right click on the selected folder to open the context menu then click Remove Shortcut Note You cannot remove default shortcuts Working with L...

Page 54: ...The link is added to the bottom of the list of existing links Click to open the drop down menu to access options for working with links Click this icon to add a link to the list Select an existing link then click this icon to edit the link s attributes Click this icon to delete a link You cannot delete a default link Select a link and click this icon to move the link up in the list Select a link a...

Page 55: ...ete the following steps to delete a link 1 Select the link you want to delete 2 Click 3 Click Remove Link when the confirmation window opens The link is removed from the list Note You cannot delete a default link Moving links up or down in the list You can change the order of the links in the list to suit your needs f Click to move a selected link up one place in the list f Click to move a selecte...

Page 56: ...nd share items using the Local Content pane and Connected Handhelds Information provided for each activity includes the name of the activity the author the date the activity was posted the size of the file and the source Note An Internet connection is required to access Texas Instruments web sites À Tool bar Á Column headings  List of available activities à List of the files contained in the acti...

Page 57: ...evel Subject Area Device Activity Time Subject Topic and Category Filtering the list of activities By default all available activities are listed in the Content pane Options on the tool bar enable you to filter the activities by subject topic and category You can also search for an activity using a keyword search To find all activities related to a particular subject 1 In the Subject field click t...

Page 58: ... Word and Adobe PDF files will open in their respective applications 3 Double click the activity to open it or click then select Open The selected tns document opens in the Documents workspace Saving an activity to your computer Complete the following steps to save an activity to your computer 1 Select the activity you want to save The file details are displayed in the bottom half of the window 2 ...

Page 59: ... select Copy Click which is located in the tool bar The activity is copied to the clipboard 3 Open a folder on your computer then select Edit Paste to copy the activity to the selected folder Sending an activity to a connected handheld Complete the following steps to send a selected activity to connected handhelds 1 Select the file you want to send to connected handhelds The file details are displ...

Page 60: ... transfer is complete close the Transfer Tool Working with connected handhelds You can use the Content workspace to perform a number of tasks To use the features described in this section your handhelds must be turned on and connected by one of these means The TI Nspire Docking Station or TI Nspire CX Docking Station TI Nspire Navigator Cradle TI Nspire CX Wireless Network Adapter A direct connect...

Page 61: ...rtfolio workspaces Á Connected Handhelds Shows all handhelds that are connected and turned on  Options Available options vary depending on the task you select under Resources à Content pane When Connected Handhelds is selected the Content pane shows details about handhelds that are connected and turned on Name of handhelds Li ion rechargeable battery charge Critical 2 25 50 75 100 or to indicate ...

Page 62: ... appear in the Content pane When a file or folder is selected the details are displayed in the Preview pane Click the icon to preview the document Details about the selected folder or file are shown in the Preview pane To view the files in a folder double click the folder name in the Content pane The files in the folder are listed in the Content pane To preview the contents of a tns file select Cl...

Page 63: ...econds Performing tasks on connected handhelds You can perform tasks on connected handhelds in the same way you do in other areas of the software Toolbar icons Edit menu Drag and drop Keyboard shortcuts Context menu option Note For easier reading descriptions here do not always show every way to perform a task For more information about working with handhelds including connecting and saving to han...

Page 64: ...select Options Paste Note If you don t select a new location the copied file is pasted with a new name Copy of Delete Delete a file on a connected handheld Select the file you want to delete Select Delete Click Yes when the Warning dialog opens Click No to cancel Refresh To refresh the list of files select Options Refresh Rename To rename a file on a connected handheld Select the file you want to ...

Page 65: ...Many lessons or activities contain multiple files For example teachers usually have a teacher version of a file a student version assessments and sometimes supporting files A lesson bundle is a container that enables you to group all files needed for a lesson together Using lesson bundles enables you to Add any type of file for example tns tnsp doc pdf ppt to a lesson bundle You can send lesson bu...

Page 66: ...on bundle Drag and drop any file into a selected lesson bundle This method moves the file to the lesson bundle If you delete the lesson bundle the file is deleted from your computer You can recover the file from the Recycle Bin Copy and paste any file into a selected lesson bundle Use the Add files to lesson bundle option This method copies the selected files into the lesson bundle The file is not...

Page 67: ... window Double click the lesson bundle file or Right click the name of the lesson bundle to open the context menu then select Open 3 Click Add Files to Lesson Bundle to open the Add window Note You can also click Add Files to Lesson Bundle in the Preview Pane ...

Page 68: ...file to the bundle The file is copied to the lesson bundle and the file name is listed in the lesson bundle window 6 Repeat this process until all needed files are added to the lesson bundle Selecting files to create a lesson bundle Within the software you can select multiple files in a folder then create the lesson bundle You cannot add a folder or a lesson bundle to a lesson bundle 1 In the Cont...

Page 69: ...Ctrl O Macintosh O When you open a lesson bundle the files in the bundle are displayed in a separate window Note You cannot open a lesson bundle outside of the TI Nspire software For example if you open the folder using the file manager on your computer and double click the lesson bundle name it does not automatically launch the software Opening files within a lesson bundle You can open any file w...

Page 70: ...he content pane select the lesson bundle name The Files window shows the file details in the Preview pane 2 In the Preview pane select the file name in the Files window and click to open the context menu 3 Select the action you want to perform Click Open TI Nspire and PublishView documents open in the Documents workspace When you open another file type it launches the application or program associ...

Page 71: ...A tilb file is a packaged file that contains all the contents of a lesson bundle and allows you to e mail it Click Send to Connected Handhelds to open the Transfer Tool and send the selected file to a handheld Only tns files can be sent to handhelds Managing lesson bundles Use the options menu or the context menu to copy delete rename or send a lesson bundle to connected handhelds You can also cre...

Page 72: ...re files to the lesson bundle select Lesson Bundles Add Files to Lesson Bundle Select Lesson Bundles Package Lesson Bundle to create a tilb file Click Send to Connected Handhelds to open Transfer Tool and send the lesson bundle to connected handheld Only tns files are sent to the handheld Packaging lesson bundles Packaging lesson bundles creates a package folder with a tilb file This file contains...

Page 73: ...the tilb folder Sending files to a class You can send folders and TI Nspire document files tns LearningCheck files edc and CABRI files fig to your whole class members of the class currently logged in or to individual students Class must be in session for you to send files When you send a file to the whole class all students currently logged in will receive the file immediately Students not logged ...

Page 74: ...he classroom area the software already has them selected Use the Send to handheld folder drop down list to toggle between the class folder or the top level folder on the handheld 5 Click Finish The file transfer appears in the Class Record in the Class workspace Understanding the rules of content transfer Using the Content Workspace you can transfer content between the web your computer and connec...

Page 75: ...r the content Menu options Context menu shortcuts select the content and right click your mouse for options Standard computer keyboard shortcuts such as Ctrl C to copy and Ctrl V to paste for example Icons appearing on the workspace Using menus and toolbar icons The menu items are listed in the following table as well as the corresponding toolbar icon and keyboard shortcut tco tns edc fig tcc tnc ...

Page 76: ...e the file New Folder Creates a new folder at the location you have selected Windows Ctrl N Macintosh ì N New Lesson Bundle Creates a new lesson bundle at the location you have selected Windows Ctrl L Macintosh ì L Add Files to Lesson Bundle Adds the selected file s to a selected lesson bundle Package Lesson Bundle Packages the selected lesson bundle Settings 8 Opens a dialog box that lets you cha...

Page 77: ...ected objects text applications pages or problems Delete key Select All Select all items Windows Ctrl A Macintosh ì A Content 8 Create Shortcut Customize the content under Local Content by creating shortcuts Remove Shortcut Remove shortcuts that you have created in Local Content Note You cannot remove default shortcuts Links 8 Add New Link Customize the links in the resources pane by creating a ne...

Page 78: ...elected link down one level in the list of links Move to Bottom of List Move the selected link to the bottom of the list of links View Local Content Changes the left panel to display a selected Local Content item Windows Ctrl Shift C Macintosh ì Shift C Links Changes the left panel to display a selected My Links item Windows Ctrl Shift L Macintosh ì Shift L Web Content Changes the left panel to di...

Page 79: ...llet next to an item denotes sort status Sort by When viewing web content lets you sort by subject matter Tools Quick Poll Opens a tool that allows you to send a quick poll to students with connected handhelds Class must be in session Windows Ctrl Alt Q Macintosh ì Alt Q Screen Capture 8 Capture the screen of the active page of a current document or a student s connected handheld or an entire clas...

Page 80: ...dentify Selected Handheld Enables you to locate a handheld in the TI Nspire Docking Station or TI Nspire CX Docking Station Install Handheld OS On a handheld you have selected allows you to select an OS file that you have downloaded and install it on the handheld Network Manager Opens a tool that lets you check the status of wireless adapters and cradles and lets you add or remove wireless adapter...

Page 81: ...nt Windows Ctrl Alt 1 Macintosh ì Alt 1 Class Workspace Opens the Class Workspace in the TI Nspire Navigator Teacher Software Use this workspace to manage classes and students use the class record panel and exchange files with students Windows Ctrl Alt 2 Macintosh ì Alt 2 Documents Workspace Opens the Documents Workspace in the TI Nspire Navigator Teacher Software Use this workspace to author docu...

Page 82: ...e your trial copy of the software This option is available only if you use a trial version of the software Manage Subscription 8 Purchase Now Purchase the software Reminder Settings Renew your license or change your reminder settings if your software is already activated Register When connected to the Internet opens a page where you can register your product Download Latest Guidebook When connecte...

Page 83: ...ting site Run TI Nspire Diagnostics Run diagnostics and send a report to TI support Check for Software Updates Locates software updates Check for Handheld OS Update Is active when a handheld is selected About Displays TI Nspire Navigator product information Welcome Screen Opens the Welcome Screen which gives you quick links to commonly used features Toolbar icon Menu option and what you can do Key...

Page 84: ...72 Using the Content Workspace ...

Page 85: ...system file with the same file extension at a time For example you can transfer a tcc and a tco file at the same time but only one tcc file at that time When transferred the TI Nspire Navigator Teacher Software converts edc and fig file types into tns file types Transfer Tool interface The Transfer Tool window contains a Setup tab and a Status tab Setup tab The Setup tab allows you to select files...

Page 86: ...ination Folder and the Size of the file or folder in KB you want to transfer Remove Selected Click to remove selected files and folders from the Transfer List This option becomes active when you add files to the Transfer List Delete all files and folders before transfer Check to clear all files and folders on a handheld before a file transfer Edit Destination Folder Select to change the destinatio...

Page 87: ...is displayed No transfers are active Use the Setup tab to configure and start the transfer During a transfer no options are available on the Setup tab Opening the Transfer Tool Before you can use the Transfer Tool you must end any running class sessions Information Description File Name Indicates the file name and extension Folder Handheld ID Indicates the destination folder and the handheld ID St...

Page 88: ... the Resources pane on to Connected Handhelds top level for all connected handhelds or an on to an individual handheld By default the Transfer Tool opens on the Setup tab Adding files or folders to the Transfer List You must add files or folders to the Transfer List before you can start a transfer Note You can only add a folder that contains files to the Transfer List To add files or folders to th...

Page 89: ...ders containing files click the Folders tab then navigate to the folder you want to select Click Select to add the highlighted folders to the Transfer List Note To select multiple folders press and hold the Ctrl key Macintosh while selecting folders Selected files and folders are displayed in the Transfer Tool window Note You can only add one operating system file type to the Transfer List If you ...

Page 90: ...stination folder Except for an operating system file you can change the destination folder for any file or folder in the Transfer List By default the Transfer Tools creates the destination folder as Transfer date The date format is based on the user s preferred language setting and location For example the default date format for the United States is mm dd yy If you change your preferred language ...

Page 91: ...ou selected Deleting all handheld files and folders You can use the Transfer Tool to delete all files and folders on a connected handheld Use this feature to delete existing files and folders to baseline student handhelds and ensure that only the files you want students to work with are on the handhelds By default the Transfer Tool disables this setting If selected the new setting becomes the defa...

Page 92: ...ist and selected other options as necessary you can start the transfer You can transfer operating system files and documents at the same time To start a transfer complete the following steps 1 Connect one or more TI Nspire handhelds If handhelds are not connected the Status tab indicates No Active Connected Handhelds when you start a transfer 2 From the Resources pane complete one of the following...

Page 93: ...sumes transferring other files as necessary Stopping file transfers You can stop a file transfer at any time To stop a file transfer complete the following steps 1 In the Tranfer Tool click Stop Transfer The Confirm dialog box opens 2 Click Yes to confirm The Transfer Tool stops transferring and switches back to the Setup tab If a connected handheld has already received files those files remain on...

Page 94: ...sing the Transfer Tool When closed the Transfer Tool clears files and folders you added to the Transfer List When closed the Transfer Tool keeps the last Delete all files and folders before transfer setting ...

Page 95: ...diately changing workspaces If a dialog box awaits a response from you enter your response and then change workspaces  Documents Workspace toolbar Shows frequently performed tasks Each of these are explained in more detail in Using menus and toolbar icons later in this chapter à Documents toolbox Contains tools such as the Tool Palette Page Sorter TI SmartView Utilities and Content Explorer Click...

Page 96: ...iew documents When you click a toolbox icon the associated tools appear in the toolbox panel Refer to the following table for information about each tool Icon What you can do Tool Palette In a TI Nspire document the Tool Palette provides a menu of tools available for working with an application The tools are specific to the active application In a PublishView document the Tool Palette allows you t...

Page 97: ...tool works almost the same as the handheld Note Content is only displayed on the TI Smartview small screen when the document is in Handheld Only or Handheld SideScreen modes Utilities Provides access to the following utilities Math Templates Symbols Catalog Math Operators Unit Conversions Libraries Content Explorer Displays a list of files and folders on your computer and on connected handhelds Yo...

Page 98: ...ts Workspace À The Documents Toolbox menu Á Tool Palette Provides a menu of tools available for working with an application Click to open the sub menu for each option  Click to close and click open the Tool Palette À Á  ...

Page 99: ...minus sign to collapse the view Click the plus sign to open the view and show the problems and pages in the document  Scroll bar The scroll bar is active when there are too many pages to show in the panel Exploring the TI SmartView Panel Use the TI Smartview tool to demonstrate concepts on the handheld to the class The TI Smartview tool works almost the same as the handheld À Á  ...

Page 100: ... show in the panel TI Nspire CX TI Nspire Touchpad TI Nspire Clickpad Select how to show the handheld Normal High contract Outline  View selector Click to select the handheld view Handheld only Keypad SideScreen Handheld SideScreen Note You can also change these options in the TI SmartView Options window Click File Settings TI Smartview Options to open the window à When the Handheld Only display ...

Page 101: ...k Browse to change the folder used to save TI SmartView files Choose the desired folder and click OK By default the files and folders in this location appear in the My Documents folder 3 Make changes to keypad faceplate and view as desired 4 Click OK Exploring the Utilities panel The Utilities panel provides access to the math templates and operators special symbols catalog items and libraries tha...

Page 102: ... wizard to enter function arguments à Tabs for opening views where you can select and add symbols catalog items math operators and library items to a document Click the tab to open the view Exploring the Content Explorer panel Use the Content Explorer panel to See a list of files on your computer See a list of files on any connected handheld Create and manage lesson bundles Update the OS on connec...

Page 103: ...r folder to open the context menu listing available actions for that file or folder à Click to close the list of files Click to open the list of files Ä Options menu Click to open the drop down menu of actions you can perform on a selected file Open an existing file or folder Move navigate up one level in the folder hierarchy Create a new folder Create a new lesson bundle Rename a file Copy a sele...

Page 104: ...andheld Using the workspace The space on the right side of the window provides an area for creating and working with TI Nspire and PublishView documents This space provides a view of the document so that you can add pages add applications and perform all work Only one document at a time is active You can view TI Nspire documents in one of two modes Computer mode or Handheld mode Both modes remembe...

Page 105: ... Nspire Navigator Cradles are currently connected to the system You can click here to launch the Network Manager window Á Student login status The student login status shows how many students are currently logged into class and how many students are assigned to the current class If class is not in session the student login status shows Class not started  Problem and page number References the cur...

Page 106: ...ed You can change the default settings at any time and you can specify the settings for a specific document Graphs Geometry settings control how information is displayed in open problems and in subsequent new problems When you change the Graphs Geometry settings the selections become the default settings for all work in these applications Changing General settings Complete the following steps to c...

Page 107: ...he list of settings Click to open the drop down list to view the available values for each setting Field Value Display Digits Float Float1 Float12 Fix0 Fix12 Angle Radian Degree Gradian Exponential Format Normal Scientific Engineering Real or Complex Format Real Rectanglular Polar ...

Page 108: ...raphs and geometry 1 Create a new document or open an existing document 2 From the status bar double click Settings or select File Settings Document Settings to open the Document Settings window 3 Click Graphs Geometry to view the current settings Calculation Mode Auto CAS Exact Approximate Note Auto mode displays an answer that is not a whole number as a fraction except when a decimal is used in ...

Page 109: ...ing 5 Use the mouse to select the desired setting 6 Click a check box to enable or disable an option Field Values Display Digits Auto Float Float1 Float12 Fix0 Fix12 Graphing Angle Auto Radian Degree Gradian Geometry Angle Auto Radian Degree Gradian Checkbox Operation when selected Automatically hide plot labels Plot labels are displayed only when selected grabbed or hovered ...

Page 110: ...rrently logged in will receive the file immediately Students not logged in will receive the file when they log in Note File types edc and fig are converted to tns files when they are sent to the class 1 From the Content Explorer navigate to the file you want to send to the handheld 2 Click the file to select it 3 Click Send to Class or Select File Send to Send to Class to send the file to the clas...

Page 111: ... any students selected in the classroom area the software already has them selected Use the Send to handheld folder drop down list to toggle between the class folder or the top level folder on the handheld 5 Click Finish The file transfer appears in the Class Record in the Class workspace Sending files to a handheld You can send folders lesson bundles and TI Nspire document files tns LearningCheck...

Page 112: ... files are sent to the handheld View all the files in a lesson bundle using the TI Nspire Software Group all files associated with one lesson in one place E mail one lesson bundle file to teachers or students instead of looking for and attaching multiple files In the Documents workspace options for working with lesson bundles are in the Content Explorer Creating a new lesson bundle Complete the fo...

Page 113: ...esson bundle option To add files to the bundle using the Add files to lesson bundle option 1 From the Content Explorer double click the lesson bundle file to open the lesson bundle window The window name reflects that name of the lesson bundle 2 Click Add Files to Lesson Bundle to open the Add window 3 Use the file manager to navigate to and select the file you want to add to the lesson bundle You...

Page 114: ...elect the lesson bundle then right click and select Open from the context menu f Select the lesson bundle click then select Open f Select the lesson bundle then press Ctrl O Macintosh O When you open a lesson bundle the files in the bundle are displayed in a separate window Note You cannot open a lesson bundle outside of the TI Nspire software For example if you open the folder using the file mana...

Page 115: ...Click or double click the lesson bundle name to open the New Lesson Bundle window 4 Select the file you want to work with and right click to open the context menu 5 Select the action you want to perform Click Open to open the file in the workspace Click Copy to place the file in the clipboard Navigate to a folder on your computer or select a handheld then right click and select Paste to place the ...

Page 116: ...u can e mail the tilb file to other teachers or students To attach the lesson bundle to an e mail 1 In your e mail client select the option needed to attach a file then navigate to the tilb folder 2 Make sure you open the folder and select the tilb file to attach to the email You cannot email the tilb folder Managing lesson bundles Use the options menu or the context menu to copy delete rename or ...

Page 117: ...se caution when deleting a lesson bundle You should ensure files contained in the bundle are backed up if you need the files for future use Select All highlights all files in the open folder This action does not apply to lesson bundles Click Package Lesson to create a tilb file Click Refresh to update the list of files in the open folder Sending lesson bundles to connected handhelds 1 In the Conte...

Page 118: ...ect TI Nspire tco If you are upgrading a TI Nspire CX CAS handheld select TI Nspire tcc If you are upgrading a TI Nspire handheld select TI Nspire tno If you are upgrading a TI Nspire CAS handheld select TI Nspire tnc A progress screen is displayed 7 When the operating system software has transferred to your handheld click OK You may now disconnect the handheld from your computer and the operating...

Page 119: ...l O Macintosh ì O Close Closes the active document Windows Ctrl W Macintosh W Save Document Displays a file browser window to let you save an existing TI Nspire file to your computer If you have previously saved the file Save Document automatically saves the changes in the same location and with the same name Windows Ctrl S Macintosh ì S Save As Save an existing file with a new name Send To Handhe...

Page 120: ... to print the current document Windows Ctrl P Macintosh P Settings 8 Change a language or edit and save document settings or TI SmartView options Change Language 8 Select a different language Document Settings 8 Set how numbers are displayed in documents and set Graphs Geometry settings TI SmartView Options 8 Change the settings for the TI SmartView emulator Document Properties View and edit autho...

Page 121: ...ut copies the content to the computer s clipboard Windows Ctrl X Macintosh X Copy Copy the selected information Copy also copies the content to the computer s clipboard Windows Ctrl C Macintosh ì C Paste Inserts content either cut or copied at a chosen location Windows Ctrl V Macintosh ì V Rename Lets you rename a file or folder Windows F2 Delete Deletes the selected objects text applications page...

Page 122: ...The border is highlighted to indicate the selected application Swap Application Change the positions of multiple applications on a page Delete Application Delete one of the applications on a page Delete Page Delete a page from a problem Group Adds the next page to the current page Group up to four applications in a single page Ungroup Separates the applications on the page to individual pages Colo...

Page 123: ...Macintosh option Shift H Scaling Boldness In Handheld mode adjust the document size to 100 150 or 200 In Computer mode adjust the thickenss of text and lines to Normal Bold or Extra Bold Previous Page Navigate back one page in the document Windows Ctrl Macintosh option Next Page Navigate forward one page in the document Windows Ctrl Macintosh option Insert Problem Add a problem to a document Toolb...

Page 124: ...hs Geometry Lists Spreadsheet Data Statistics Notes Vernier DataQuest Question Image Insert an image into a document The application must support images Text Insert a text box into a PublishView document Program Editor 8 Insert a new program or open import or view an existing program Toolbar icon Menu option and what you can do Keyboard shortcut ...

Page 125: ...ts on their handhelds while in the Quick Poll session Allow Resubmit Allow students to continue to submit answers to the Quick Poll until you stop the poll Screen Capture 8 Capture the screen of the active page of a current document or a student s connected handheld or an entire class of connected handhelds Capture Class Captures the screens of selected student handhelds or the entire class in the...

Page 126: ...toried libraries Install Handheld OS Allows you to select an OS file that you have downloaded and install it on the handheld you have selected Network Manager Opens a tool that lets you check the status of wireless adapters and cradles and lets you add or remove wireless adapters cradles and access points from the classroom system Class Select Class 8 Displays a list of available classes for you t...

Page 127: ...b content Windows Ctrl Alt 1 Macintosh ì Alt 1 Class Workspace Opens the Class Workspace in the TI Nspire Navigator Teacher Software Use this workspace to manage classes and students use the class record panel and exchange files with students Windows Ctrl Alt 2 Macintosh ì Alt 2 Documents Workspace Opens the Documents Workspace in the TI Nspire Navigator Teacher Software Use this workspace to auth...

Page 128: ...el Windows Ctrl Alt P Macintosh ì Alt P TI SmartView Emulator Opens the TI SmartView emulator in the Toolbox panel Windows Ctrl Alt E Macintosh ì Alt E Content Explorer Opens the Content Explorer panel in the Toolbox panel Windows Ctrl Alt O Macintosh ì Alt O Utilities Opens the Utilities panel in the Toolbox panel Windows Ctrl Alt U Macintosh ì Alt U Show Documents in Tiles Tabs Toggles the docum...

Page 129: ...er settings if your software is already activated Register When connected to the Internet opens a page where you can register your product Download Latest Guidebook When connected to the Internet opens a page where you can download the latest product guidebooks Visit education ti com When connected to the Internet opens the Texas Instruments Education Technology site Visit Activities Exchange When...

Page 130: ...Software Updates Locates software updates Check for Handheld OS Update Is active when a handheld is selected About Displays TI Nspire Navigator product information Welcome Screen Opens the Welcome Screen which gives you quick links to commonly used features Toolbar icon Menu option and what you can do Keyboard shortcut ...

Page 131: ...e are two types of documents TI Nspire document tns file PublishView document tnsp file TI Nspire documents A TI Nspire document consists of one or more problems and each problem contains one or more pages A single page is displayed in the workspace on your screen All work occurs in the applications within pages Because the TI Nspire software and the TI Nspire handhelds share the same functionalit...

Page 132: ...n active application to a new document Creating a new TI Nspire document To create a new TI Nspire document complete the following steps 1 From the menu bar in the Documents workspace select File New TI Nspire Document or click on the tool bar then select New TI Nspire Document The new document opens in the Documents workspace and you are prompted to select an application By default new documents ...

Page 133: ... The document closes and is saved with the extension tns Note When you save a file the software will first look in the same folder the next time you open a file Saving a document with a new name To save a previously saved document in a new folder and or with a new name 1 Select File Save As from the menu bar The Save TI Nspire Document dialog box opens 2 Navigate to the folder where you want to sa...

Page 134: ... workspace Note To select from your 10 most recent documents click File Recent Documents and select a document from the drop down list Using Content Explorer to locate files The Content Explorer is a file browser that lists files on your computer and on any connected handheld Use the Content Explorer to Transfer files and folders between your computer and any connected handhelds Copy and paste fil...

Page 135: ...ld file browser This section of the pane contains folders and files on a connected handheld Å Context menu Click to open the drop down menu listing options for working with folders and files in the Content Explorer Æ Expand collapse double arrows Click here to expand or collapse the Computer or Handheld file browser You can select files and folders in the Content Explorer file browser pane and dra...

Page 136: ...iles are transferred and the unsupported files are ignored All files in a lesson bundle will appear in the Content Explorer Saving a document to a connected handheld From the Documents workspace complete the following steps to save a document to a connected handheld Note Use a standard USB cable to connect a single handheld to a computer In the classroom use the TI Nspire Docking Station or TI Nsp...

Page 137: ... want to replace the file To overwrite the file click Replace To abandon the save click Cancel 5 A dialog box shows that the file is being saved Note Any file saved to a handheld will be saved as a tns file Opening handheld documents in the software You can open documents from a handheld directly in the software You can then work with the documents and save them through ordinary save commands To o...

Page 138: ...re in the process of copying a group of files cancel the operation by clicking Cancel Only those files that haven t yet been transferred to the destination will be canceled Other files will have already been transferred Note If you copy to a connected handheld only tns supported documents can be copied Creating new folders 1 In the Computer or Connected Handhelds pane click then select New Folder ...

Page 139: ...nts are open you can view thumbnails of the documents in the workspace To change the view Select Window Show Documents in Tiles Open documents are shown as thumbnails in the workspace and the scroll bar become active À Click the tab to show a document in the work space This document becomes the active document If the Show Documents in Tiles view is open these tabs are not shown Á Use the right and...

Page 140: ...lick the Close icon on the document tab at the bottom of the document If using the tiled view click the Close icon in the upper right corner of the document window Working with applications When you first open a new document or add a new problem to a document select an application from the menu The following illustration shows how a problem with the Lists Spreadsheet application appears in the wor...

Page 141: ...ve document or change the default settings See Using the Documents Workspace for information about changing settings à Document View Enables you to switch between computer mode and handheld mode Ä Scaling Boldness When in computer view use this scale to increase or decrease the boldness of the document When in handheld view use this scale to make the image larger or smaller Opening Document Tools ...

Page 142: ...multiple problems and pages in the document the tools specific to the application on the active page are shown in the Document Tools menu when you select the page Opening context menus Use context menus to access options specific to a selected object or the current cursor location 1 To access a context sensitive menu for an application right click in the work area The following example shows the c...

Page 143: ...e multiple applications Adding the applications You can add multiple applications to a page even if an application is already active Adding multiple applications to a page By default each page contains space to add one application To add additional applications to the page complete the following steps 1 Click Edit Page Layout Select Layout or click from the tool bar to open the page layout menu Th...

Page 144: ...selected as the first application to be swapped 2 Click on the second application to swap This action performs the swap Note When there are only two work areas the selected application automatically swaps position with the other application on the work area To cancel a swap press Esc Selecting and moving pages with the Page Sorter The Page Sorter is part of the Documents Toolbox Use the Page Sorte...

Page 145: ...he work area If you are working on a page in the work space this page is indicated in the Page Sorter by a color border If you are actively using the Page Sorter the active page displayed in the work space has a color border in the Page Sorter pane Clicking on any page in the Page Sorter makes it the active page and it is displayed in the work space Rearranging pages Use the Page Sorter to change ...

Page 146: ... you want to delete 2 Select Edit Page Layout Delete App The application is deleted If you want to undo the delete type Ctrl Z Macintosh ì Z Deleting pages You can delete an entire page using the delete tools on the tool bar 1 Select the page you want to delete 2 Select Edit Delete or right click and select Delete Working with problems and pages When you create a new document a problem is added wi...

Page 147: ... problem from the document Copying and pasting a problem To copy and paste the problem 1 In the Documents Toolbox click to open the Page Sorter 2 Click a problem to select it 3 Press Edit Copy or Ctrl C Macintosh ì C 4 Go to the location where you want the problem to appear 5 Press Edit Paste or Ctrl V Macintosh ì V A duplicate problem is placed in the new location Deleting a problem To delete a p...

Page 148: ...ies pane is located in the Documents Toolbox To access the Utilities pane 1 Select Windows Utilities or click The Utilities pane opens in the Documents Toolsbox 2 Click each tab to open a palette of items Use the Utilities pane for quick access to the following items Math templates Contains math templates for creating two dimensional objects including product sum square root and integral ...

Page 149: ...Working with TI Nspire documents 137 Symbols Provides a symbol palette for adding special characters Catalog Contains all commands and functions in alphabetical order ...

Page 150: ...unctions CAS Unit conversions Provides the values for standard measurement units Libraries Shows Public library LibPub objects defined in the documents located in the MyLib folder Note For more information about libraries please see the Library section of the documentation ...

Page 151: ... each item or view syntax information Using wizards Wizards provide help for entering functions and performing tasks for items in the Utilities pane such as LinRegMx and OneVar The symbol appears next to items that are supported by wizards To use a wizard 1 In the Utilities pane click the tab to open the set of utilities you want to work with For example click Catalog 2 Click the check box next to...

Page 152: ...ents opened on the TI Nspire CX handheld If a document containing color is opened on a TI Nspire handheld it displays in shades of gray Note For more information about how to use color in specific objects such as a shaded area in Data Statistics refer to the documentation for that application Adding color from a list To add color to a fill area line or text do the following 1 Select the item 2 Cli...

Page 153: ...an be pasted into another application such as Microsoft Word Capturing a page 1 Open a document and select the page you want to capture 2 Click To capture the current page on your computer select Capture Page To capture the current page on a connected handheld select Capture Selected Handheld Note You can also select Tools Screen Capture to access the Capture Page and Capture Selected Handheld opt...

Page 154: ...pire Screen Capture window It replaces the image in the clipboard Click to copy an image to the clipboard Click to delete an image Click to zoom in Click to zoom out Click and toggle between Single Screen View and Thumbnail View if there are multiple captured pages Click to add a border to the selected image Click to remove a border from a selected image Click or to scroll through multiple capture...

Page 155: ... designated location Printing documents If your computer is connected to a printer you can print an open document 1 Select File Print to open the Print dialog 2 Once you have selected the details of your print job click Print The Print dialog enables you to control the following in your print job The printer Print What Viewable Screen prints what is visible in the active document Print All prints ...

Page 156: ...ore the Print defaults click Reset Using print preview You can also preview the document from the Print dialog With the View Preview checkbox selected use the arrows at the top of the right pane to page through the pages in the preview Viewing document properties and copyright information Viewing copyright information If a teacher has added copyright information to a document you can view that inf...

Page 157: ...w file To make a document read only 1 Open the document 2 Click File Document Properties 3 When the Document Properties dialog box opens click the Protection tab 4 Select the checkbox next to Make this document Read Only 5 Click OK Adding copyright information to a document Note This section applies only to the Teacher Software You can add copyright information individually to documents you create...

Page 158: ...ine the copyright details Author Copyright Public Domain or Copyright Note If you select Public Domain you cannot enter a year or owner Year Owner Comments 3 To add the supplied information to all new documents from this point forward select Apply this copyright to all new documents 4 Click OK to apply the copyright information to the document ...

Page 159: ...e inserted into TI Nspire applications that allow images Capture Page Capture the active page in a TI Nspire document from the software or from the TI SmartView emulator as an image Save captured images as jpg gif png or tif files which can be inserted into TI Nspire applications that allow images Copy and paste images into another application such as Microsoft Word Capture Selected Handheld Captu...

Page 160: ...ring student handheld screens 1 If you have not already done so begin the class session and ask your students to log in 2 Click then select Capture Class The Select Individual s window opens If you selected students in the Class workspace view those student names are highlighted If no students were selected all student names in the class are selected 3 To change the selected student or add more st...

Page 161: ...ou refresh your screen any students who log in after the initial screen capture will be listed at the end of the Class Screen Capture window 4 Click OK The screens of the selected students are displayed in the Class Screen Capture window Note The example below shows the screens from two selected student handhelds who are logged in The default view is Tiled which shows all screens captured in the w...

Page 162: ...r provides options for working with captured images Click an option to open a drop down menu that lists options needed to perform tasks If applicable shortcut keys are also listed The tool bar provides quick access to options frequently used when working with captured images These options are also accessible from the menu bar Option Description Icon Shortcut key File Menu Save Selected Screen s Sa...

Page 163: ...tosh G Refresh Now Click to refresh the view immediately F5 Auto Refresh Select to turn on the auto refresh feature If turned on you can select how often the view is refreshed Zoom In Make the view larger Ctrl Up Macintosh Up Zoom Out Make the view smaller Ctrl Down Macintosh Down Zoom Percentage Select percentage to increase or decrease a screen image when zooming in or out Show Student Names Sel...

Page 164: ...the TI Nspire Navigator Teacher Software window select File Settings Teacher Preferences The Teacher Preferences dialog box opens 2 If you haven t already done so create a Username and Password 3 Select Add teacher to classroom view to show your handheld in the Class Screen Capture window 4 To randomize the order in which screens are captured select Randomize order in Screen Capture 5 Select the I...

Page 165: ...l be increased or decreased Showing or hiding student names Accessing Live Presenter options See Using Live Presenter for more information Toggling between Tiled and Gallery views When you capture student handheld screens the default view for the Class Screen Capture window is Tiled Switch to Gallery view to show an enlarged view of a selected screen Thumbnail views of all the captured screens are...

Page 166: ...show student names names are centered under each student s captured screen Zoom functions are disabled in Gallery View You can change the order of the screens in the Gallery View The width of the thumbnail pane cannot be changed Rearranging captured screens Complete the following steps to change the order of the captured screens within the Class Screen Capture window 1 Click the desired screen to ...

Page 167: ...s needed Click The latest screens from the connected handhelds are captured and displayed in the Class Screen Capture window Note If a student handheld has lost connection and a screen cannot be refreshed it is outlined in yellow Enabling the auto refresh screen capture feature The auto refresh feature is useful for monitoring class performance This feature enables you to automatically refresh the...

Page 168: ...captured screens From the toolbar click to increase the size of the screens in the view You can also select View Zoom In from the menu From the toolbar click to decrease the size of the screens in the view You can also select View Zoom Out from the menu Setting a zoom percentage The Zoom Percentage option enables you to select the percentage by which the screen image is increased or decreased when...

Page 169: ... will have to scroll the viewing pane to see them 2 Select Edit Compare Selected If you are in Tiled view the view switches to Gallery view and the selected screens are listed in the order selected Note This option is disabled when in Gallery view 3 To exit comparison mode click outside the screen in the left pane of the Gallery view Using Make Presenter Select a captured screen from the Class Scr...

Page 170: ...select the screen or screens you want to save as image files To select multiple consecutive screens click the first image then hold down the Shift key and click the additional images To select screens in random order hold down the Ctrl key Macintosh and click each image you want to save To select all captured screens select Edit Select All 2 Select File Save Selected Screen s or click Ctrl S Macin...

Page 171: ...ou can print screens captured using the Capture Class option You can print one multiple or all captured screens For each printed page the class name is printed in the page header and the date and page number are printed in the page footer Note The print option is not available when using the Capture Page or Capture Selected Handheld options To print a captured screen 1 Select the screen you want t...

Page 172: ...n save images in the following file formats jpg gif png and tif Saved images can be inserted into TI Nspire applications that allow images The image is also copied to the clipboard and can be pasted into other applications such as Microsoft Word or PowerPoint Capturing a page Complete the following steps to capture an image of an active page 1 In the Documents workspace open a document and navigat...

Page 173: ...ard Using Capture Selected Handheld Use the Capture Selected Handheld option to capture the active screen on a connected handheld 1 On a connected handheld navigate to the menu or to a page in a document you want to capture 2 In the TI Nspire Navigator Teacher Software select the connected handheld In the Content workspace select the handheld from the list of Connected Handhelds in the Resources p...

Page 174: ... Capture window You can capture additional screens from an open document on a connected handheld or open another document on a connected handheld to capture screens from that document As you capture additional screens the images are copied to the Screen Capture window which holds multiple images The last screen captured replaces the contents of the clipboard Viewing captured screens When you captu...

Page 175: ... when working with captured images These options are also accessible from the menu bar Option Description Icon Shortcut Key File Menu Save Selected Screen s Save only selected screens if multiple screens are captured Ctrl S Macintosh S Save All Screens Save all captured screens Close Close the Screen Capture window Ctrl W Macintosh W Edit Menu Copy Copy a selected screen to the clipboard Ctrl C Ma...

Page 176: ...rder Toggle to add or remove a border from around the captured screens View Menu Thumbnail View Click to show a tiled view of all captured screens Single Screen View Click to show only the selected screen in the window or see one image at a time Previous Return to previous screen Left arrow key Next Move the next captured screen Right arrow key Zoom In Make the view larger Ctrl Plus sign Macintosh...

Page 177: ...e at a time select multiple images to save or save all captured images Saving selected screens 1 In the Screen Capture window select the screen image you want to save 2 Select File Save Selected Screen s Note From the Screen Capture window you can also click The Save as window opens 3 Navigate to the folder on your computer where you want to save the file 4 Type a name for the file Note The defaul...

Page 178: ... a new folder name The default folder name is MM DD YYYY Image where MM DD YYYY is the current date 5 Select the file type for the image files The default format is jpg Click to select another format gif tif or png 6 Click Save The images are saved in the specified folder with system assigned names reflecting the current date and a sequence number For example MM DD YYYY Image 001 jpg MM DD YYYY Im...

Page 179: ...o copy 2 Click or select Edit Copy The selected screen is copied to the clipboard Pasting a screen Depending on the application you are pasting to click Edit Paste Note You can also drag a screen capture to another application This functions as a copy and paste ...

Page 180: ...168 Capturing Screens ...

Page 181: ...h instance of this application but each instance can have the same or different image Geometry Image is set in background behind the axis and other objects A maximum of one image can be used in each instance of this application but each instance can have the same or different image Data Statistics Image is set in background behind the axis and other objects A maximum of one image can be used in ea...

Page 182: ... application example shown above illustrates that each page can use the same or a different image but only one image is allowed per page The Notes application example shown above illustrates that you can use multiple images and the image is placed in line with the text ...

Page 183: ...G Joint Photographic Experts Group BMP Device independent Bitmap PNG Portable Network Graphics The transparency feature of png is not supported Any transparent png backgrounds appear as white Inserting the image There are two ways you can insert images into a document Use the Insert command from the menu by browsing for the file or Paste the image into the document from the Clipboard Warning When ...

Page 184: ...u want to place the picture For example Graphs 2 From the Menu bar click Insert Image Note If the application selected does not accept images the menu item Image is grayed out 3 Navigate to the image s location and select your image 4 Click Open The image appears in your application ...

Page 185: ...b Copy or Paste Inserting an image by pasting 1 Open the application and the document where you want to place the image 2 Click Edit Paste PC Ctrl V Mac Command V Handheld b Paste The image is now on the page The application type determines whether the image displays in foreground or background See TI Nspire applications that can accept images Inserting an image using the context menu right click ...

Page 186: ... with images When working with images you have a visual cue that the image is selected by observing a bold and colored border around the image Selecting the image Use one of these methods to select images as used in moving resizing and deleting images Software 1 Right click on the image to access the context menu 2 Choose Select Image Handheld 1 Once you are at the image click Menu 2 When the menu...

Page 187: ...the pointer over the image border The cursor will change to a multisided arrow You can then hold the mouse button or if using a handheld use the touchpad arrows to move in or out NOTE If you resize by using one of the corner handles the image retains the same proportions as it is resized If you resize by using one of the side handles your image will lose its aspect ratio Example of resizing an ima...

Page 188: ...e size you can attempt to insert is 10 MB This is not the actual size the image will retain only the maximum size that the memory accepts before inserting The TI Nspire system automatically adjusts the image if necessary for performance If a document with images cannot be opened due to low available memory the document is not opened and a notification is displayed Pixel The resolution of an image ...

Page 189: ... Teachers can create printed materials to complement documents used on TI Nspire handhelds When working with lesson plans teachers can Create lesson plans from existing handheld documents or convert lesson plans to handheld documents Link to related lesson plans or documents Embed explanatory text images video and links to web resources Build or interact with TI Nspire applications directly from t...

Page 190: ...blishView document 1 From the Documents workspace select File New PublishView Document or click and select New PublishView Document A blank letter size document opens in the Documents workspace The orientation is portrait which cannot be changed The default margin settings for the top and bottom margins are one inch There are no settings for side margins By default a problem is added to the docume...

Page 191: ...an be moved and resized When you insert TI Nspire applications they work the same way as pages in a TI Nspire document In a PublishView document objects can overlap each other and you can control which object is on top or bottom Objects can be placed and positioned in a PublishView document in a free form fashion You can convert an existing TI Nspire document to a PublishView document tnsp file Wh...

Page 192: ...ishView document The following example shows how you might use TI Nspire applications and PublishView objects to build a PublishView document In this example borders are turned on to show the boundaries around the objects Showing borders enables you to work with objects easily while building a document When you are ready to print or publish the document to the web you can select to the hide border...

Page 193: ...t boxes are not retained when you convert a PublishView document to a TI Nspire document à TI Nspire applications In this example the author uses Graphs Geometry to show the math functions When a TI Nspire application is active in a PublishView document the appropriate application menu opens in the Documents Toolbox You can work in a TI Nspire application just as you would in a TI Nspire document ...

Page 194: ...to change General Settings and Graph and Geometry Settings You can specify settings that are specific to an active document or set default settings for all PublishView documents When you convert a TI Nspire document into a PublishView document the settings in the TI Nspire document convert to the settings defined for PublishView documents  Document View is not active in a PublishView document You...

Page 195: ... document The document closes and is saved with the extension tnsp Note When you save a file the software will first look in the same folder the next time you open a file Saving a document with a new name To save a previously saved document in a new folder and or with a new name 1 Select File Save As from the menu The Save TI Nspire Document dialog box opens Ä When there are too many open document...

Page 196: ...uments Save documents Use the copy paste undo and redo options Delete documents Access TI Nspire application specific menus Open the Variables menu in TI Nspire applications that allow variables Access and insert math templates symbols catalog items and library items into a PublishView document Note For more information about the menu and toolbar options see Using the Documents Workspace Exploring...

Page 197: ...ons and PublishView objects Click to open the Utilities panel where you can access Math Templates Symbols the Catalog Math Operators and Libraries Click to open Content Explorer Note For more information about Utilities and Content Explorer see Using the Documents Workspace Á Click to collapse a pane containing a menu Click to expand a pane À Á Â Ã Ä ...

Page 198: ... menu which displays the actions that can be performed on that object Use add insert and paste to add objects to a PublishView document  TI Nspire applications Drag and drop an icon to a problem to insert an application Calculator Graph Geometry Lists Spreadsheet Data Statistics Notes Vernier Dataquest Question Picker Only available in TI Nspire Teacher Software or TI Nspire Navigator Teacher sof...

Page 199: ...preadsheet application a context menu opens providing a list of actions that you can perform on that cell When you right click the border of a text box in a PublishView document the context menu provides actions that can be performed on the text box Context menus in TI Nspire applications When you insert a TI Nspire application into a PublishView document the application menu and the context menus...

Page 200: ...nteractive State Description Unselected When unselected an object does not have handles for repositioning and sizing To deselect an object left click or right click outside the object In this example borders around the object are showing Selected When selected an object will have eight square handles framing the object To select an object click the object s borer When selected objects can be moved...

Page 201: ...eractive An interactive state is indicated by a blue frame around the object To enter interactive state left click or right click anywhere in the body of the object When in an interactive state you can work with the contents of the object For example you can add or edit text in a text box or complete math functions in a TI Nspire application When in an interactive state context menus contain optio...

Page 202: ...nus Right click the border of any object in a PublishView document The context menu opens to provide access to delete copy paste cut and bring to front send to back actions Resizing an object 1 Click any border around the object to select it The border becomes a bold blue line and the handles are active Selected text boxes and frames can be resized moved copied pasted and deleted ...

Page 203: ...lick any border around the object to select it The border becomes a bold blue line and the handles are active 2 Move your cursor over one of the borders to activate the positioning tool 3 Click to grab the object The horizontal and vertical alignment guides are activated at the top and bottom of the object Use the grid lines to position the object on the page 4 Drag the object to a new location on...

Page 204: ...in the classroom For example you can create a curtain control by placing and empty text box over other objects Then you can move the text box to reveal the items below it one at a time To change the position of an object in the stacking order 1 Click the border of the object you want to position to select it then right click to open the context menu 2 Click Send to back or Bring to front to move t...

Page 205: ... Folder field in the PublishView Objects pane to select a folder for storing PublishView documents and related files 1 Ensure the PublishView Objects pane is open 2 Click The Choose Your Working Folder window opens 3 Navigate to the folder where you want to store video and image files 4 Click Open to choose the working folder The selected folder becomes the working folder and the folder name is di...

Page 206: ...n to a problem To add a TI Nspire application to a problem in a PublishView document 1 Choose one of the following actions to select an application From the TI Nspire Applications pane in the Documents Toolbox use the mouse pointer to point to the application and drag it to the problem From the menu bar select Insert and choose an application from the drop down menu Right click inside the sheet to...

Page 207: ...sions 4 To open the menu for the active TI Nspire application click inside the application The menu opens in the Documents Toolbox above the TI Nspire Applications pane Right click on an application element such as a cell or function to open the context menu for that item 5 To work in the application select an option from the application menu Click to collapse the application menu pane ...

Page 208: ...You can drag and drop complete problems or individual pages onto the PublishView sheet Choosing a working TI Nspire document To choose a working document 1 In the Documents Toolbox ensure the TI Nspire Documents pane is open 2 Click The Choose Your Working Document window opens 3 Navigate to the folder where the TI Nspire document is stored Click in the Look in field to use a file browser to locat...

Page 209: ... 4 Select the file then click Open The TI Nspire document opens in the TI Nspire Documents pane 5 To add the TI Nspire document to the PublishView document drag and drop one page at a time or one problem at a time to the PublishView sheet If you are adding a problem with multiple pages the pages are stacked on top of each other on the PublishView sheet Move the top page to see the other pages ...

Page 210: ...m break is always inserted after the selected problem Inserting a problem break adds empty space below the break Any object between two problem breaks is part of the problem above the break The last problem includes all sheets and objects below the last problem break Problem breaks are not relative to any object which lets you move objects within a problem without affecting the problem break locat...

Page 211: ...breaks You can select to hide or show problem breaks in a PublishView document By default problems breaks are shown 1 Right click in any blank area of the document outside of any object to open the sheet context menu 2 Select Layout Options The Show Hide Options dialog box opens Note You can also select View PublishView Layout Options 3 Deselect the Show problem breaks option to hide problem break...

Page 212: ...he PublishView objects and TI Nspire applications within sheets Adding sheets to a problem To add a sheet to a problem Select Insert Sheet The sheet is added to the problem and the numbering increments by one Opening the sheet context menu Right click in any blank area outside of any object in a PublishView sheet A context menu opens with options for inserting problems pages applications and Publi...

Page 213: ...en activated a text box with a light gray border is displayed Inserting and editing text in headers and footers 1 Click inside the top or bottom margin The text box borders in the margin become visible and the object space is disabled The cursor is placed in the header or footer space and the formatting menu opens 2 Type the text The default font is TI Nspire true type 12 pt normal By default text...

Page 214: ...the sheet outside of any object to open the context menu 2 Select Layout Options The Layout Options dialog box opens Note You can also select View PublishView Layout Options 3 Deselect the Show object borders option to hide the borders around the objects in the problem Select the option to return to the default setting and show borders 4 Click OK to close the dialog Adding and removing space To ma...

Page 215: ...ve Space tool becomes active 3 Use your mouse to position the tool to the exact place where you want to add space 4 Click the tool then drag down to select the amount of space you want to add As you select the amount of space to be added it is indicated in green Add Remove Space tool ...

Page 216: ...the area outside of any object where you want to remove space The context menu opens 2 Select Edit Add Remove Space The Add Remove Space tool becomes active 3 Use your mouse to position the tool to the exact place where you want to remove space 4 Click the tool then drag up to select the amount of space you want to remove As you select the amount of space to be removed it is indicated in red Add R...

Page 217: ...o enter free form text or copy text from other sources into the document For example you can place a PublishView text box next to an image and type a description in a text box You can also copy and paste text from doc txt and rtf files Use PublishView text boxes when you need options for emphasizing and formatting text PublishView text boxes are not converted when you convert a PublishView documen...

Page 218: ...esize the text box or position in the problem as needed 5 Click outside the text box to save the size and position 6 Click Type your text here The formatting menu opens and the text becomes active 7 Type the new text or copy and paste text from another file 8 Apply formatting as needed 9 Click outside the text box to save the text Text box is in an interactive state for adding or editing text ...

Page 219: ...tting menu and context menu open providing shortcuts to cut copy and paste Using hyperlinks in PublishView documents In PublishView documents use hyperlinks to Link to a file Link to a web site on the Internet You can add a hyperlink to an open document or you can convert any text within a text box to a hyperlink When a hyperlink is added the formatting of the text is underlined and the font color...

Page 220: ...l no longer work If a link is broken an error message is displayed when you click the link Cannot open the specified file Cannot open the specified web page Linking to a file You can link to any file on your computer If the file type is associated with an application on your computer it will launch when you click the link Complete the following steps to add a link to a file to a PublishView docume...

Page 221: ...hyperlink dialog box opens 5 Navigate to and select the file you want to link to then click Insert The path name is inserted into the Address field in the Add Hyperlink dialog box 6 Click OK A text box containing the hyperlink is added to the PublishView document 7 Using the mouse grab the handles to resize the text box or grab any border to position the text box in the document as needed ...

Page 222: ...ult web site 5 Navigate to the web site or file on a web site that you want to link to 6 Copy the URL then paste it in the Address field in the Add Hyperlink dialog box 7 Click OK A text box containing the hyperlink is added to the PublishView document 8 Using the mouse grab the handles to resize the text box or grab any border to position the text box in the document as needed Editing a hyperlink...

Page 223: ...paste the correct the URL in the Address field 3 Click OK to save the changes Converting existing text to a hyperlink 1 Click inside the text box to activate edit mode and open the formatting menu 2 Select the text you want to convert to a hyperlink 3 Click The Add Hyperlink dialog box opens with the selected text in the Text field 4 Click to create a link to a file OR Click to create a link to pa...

Page 224: ...ons that support images Supported files types are bmp jpg and png files Note If a TI Nspire application is active in the PublishView document the image is added to the TI Nspire page if you select Insert Image from the menu bar or context menu If there is no TI Nspire document active the image is added as a PublishView object Only images inside TI Nspire applications convert to TI Nspire documents...

Page 225: ...eet 5 Using the mouse grab the handles to resize the text box or grab any border to position the text box in the document as needed Moving images 1 Click the frame containing the image to select it 2 Move your cursor over the edge of the image to activate the positioning tool 3 Drag and drop the image to its new location on the PublishView sheet Note Objects can overlap each other on a PublishView...

Page 226: ...R Right click a handle to open the context menu then select Delete Working with video files You can embed a Flash flv video file in a PublishView document and play the video directly from the PublishView document Note You can also insert a link to a video that will launch in a new browser window or media player window See Working with Hyperlinks Inserting a video 1 Ensure the PublishView Objects p...

Page 227: ...n the object in the document as needed For example you may want to position the object containing the video above or below a text box that contains text introducing the video 6 To play the video click the forward arrow Using the video console The video console enables users to control when to start and stop the video The console contains the following controls À Click to start the video When playi...

Page 228: ...es to TI Nspire documents tns files for display on handhelds You can also convert TI Nspire documents to PublishView documents à Shows how high or low the volume is You cannot control the volume with this control Use the volume control on your computer to increase or decrease the volume Option Function Settings Click to disable or enable hardware acceleration Global Settings Opens the Adobe Flash ...

Page 229: ... application is converted If images are contained in a TI Nspire application they are converted however images contained in PublishView objects are not converted Complete the following steps to convert a PublishView document tnsp file to a TI Nspire document tns file 1 Open the PublishView document to be converted 2 Select File Convert to TI Nspire Document The new TI Nspire document opens in the ...

Page 230: ...ents to PublishView documents which enables you to take advantage of the richer layout and editing features for printing generating student reports creating worksheets and assessments and publishing documents to a web site or blog Complete the following steps to convert a TI Nspire document to a PublishView document 1 Open the TI Nspire document you want to convert 2 Select File Convert to Publish...

Page 231: ...rint what field is disabled 3 Select Paper Size from the drop down menu Options are Letter 8 5 x 11 inches Legal 8 5 x 14 inches A4 210 x 297 mm 4 Select the number of Copies you want to print 5 In the Print Range area select to print all pages in the document a range of pages or the current page only Note By default top and bottom margins are set to one inch and are maintained when printing a Pub...

Page 232: ...220 Working with PublishView documents Print Problem Breaks and Names Print Headers Print Footers Show object borders 7 Click Print ...

Page 233: ...t editor or HTML editor Code examples are shown in this document To use embedded web pages You must be connected to the Internet to load the TI Nspire Document Player and view the embedded document If publishing a document to the web you will need to post the original TI Nspire or PublishView documents online and update the HTML source code to reflect the URL of the online document You can embed d...

Page 234: ...code might look like the code in the following example When creating your own code for the iframe you will need to know the web address of the embedded document and include this address in your code Example Hard coded iframe Line breaks are not recognized in HTML source code You may see the iframe code strung together on a single line when you view the source code in a text editor or HTML editor T...

Page 235: ... parameters the the source attribute to control the appearance of the embedded TI Nspire Document Player These parameters are optional For more information see Customizing the embedded Document Player Defining the nspirefile parameter The nspirefile parameter is always last in the line of code and specifies the URL or the file system address path of the document you are embedding You may need to m...

Page 236: ...n Specifies the alignment of an according to surrounding elements If used values are left right top middle or bottom The align attribute will work but is no longer widely used Styles are widely used today To use styles to center the Document Player on a page surround the with division tags Specifies whether or not to display a border around an Values are 1 show border 0 no border Specifies the hei...

Page 237: ...her on a single line when you view the source code in a text editor or HTML editor To make the code easier to view you can manually add line breaks or enable Word Wrap The following example shows the code without line breaks script type text javascript src http education ti com html nspireplayer js ticreateiframe js script script type text javascript tiDeployPlayer tiCreateIframePlayer IFRAME attr...

Page 238: ...e opening the player on your computer you are asked to accept the license agreement This is only needed once for a specific machine Exporting to a web page Use the File Export Web Page option to create a stand alone web page that can be used as is or that can be modified 1 Open the TI Nspire document or PublishView document you want to embed in a web page 2 Select File Export Web Page The Web Page...

Page 239: ... the name of the file if different than the default name 8 Do not change the file type By default the file type is 9 Click Save The file is saved to your computer The embedded web page automatically opens in your default web browser If you move your exported file to another folder you must also move the associated TI Nspire or PublishView document When the TI Nspire document or PublishView documen...

Page 240: ...ath identifying where the document is located  Web browser menu bars and tool bars à Title of the embedded web page as specified in the Web page title field Ä The text as specified in the Text above the embedded window field Text that appears below the frame is specified in the Text below the embedded window field Å The containing the embedded document À Á Â Ã Ä Å Æ ...

Page 241: ...pire Document Player window are not saved Link to your online storage site For example or When you link to a site the document path is copied to the clipboard and can be pasted into the sharing site s upload field You can also add your own sites such as your or site Print the original embedded document or print the document with changes you made in the TI Nspire Document Player Undo the last chang...

Page 242: ...m go nspireplayer lock_toolbar yes openDoc no nspirefile http education ti com xchange US Math Algeb raI 11340 From_Expressions_to_Equations tns width 700 height 500 scrolling no frameborder 0 iframe script type text javascript src http education ti com html nspireplayer js ticreateiframe js scri pt script type text javascript tiDeployPlayer tiCreateIframePlayer IFRAME attributes src http educatio...

Page 243: ...e Open icon is shown The parameter must also be set for this setting to be accepted Controls the visibility of the Save Local Copy icon in the toolbar To hide the Save Local Copy icon set this parameter to No If not specified the Save Local Copy icon is shown The parameter must also be set for this setting to be accepted Controls the visibility of the Save Online icon in the toolbar To hide the Sa...

Page 244: ... to be embedded The value can be the absolute URL the file system path or the relative address If using the relative address you can use only document file name for example myfile tns The Document Player assumes the document is in the same directory as the exported document which makes the exported web page portable This means you can put the document and the embedded document in the same folder t...

Page 245: ...t This stand alone web page can be used without any changes or embellished using third party software Export HTML to Clipboard Use this option to produce a code snippet that can be pasted into existing web pages or blogs A code snippet contains a few lines of HTML code that embeds a window into an existing page Both the full HTML document and the code snippet can be easily edited using any text ed...

Page 246: ...n open the file within the text editor The source code is displayed Note In some browsers viewing the source code opens a text editor The following example shows source code that contains comments to help anyone unfamiliar with HTML to understand and successfully modify the code ...

Page 247: ... HTML documents have a Header usually hidden information and a Body displayed content TAGS The appearance of your page is controlled by tags Tags are surrounded by angle brackets Some elements require a start tag and an end tag LINES Lines in the source file mean nothing when displayed as a web page Instead tags are used to control lines on the page br creates a line break just like hitting Enter ...

Page 248: ... understanding interactive classroom educator s classroom computer head body bgcolor FFFFFF TEXT 000000 Note the background color and text color are included with the body tag You can find out more about color codes here http en wikipedia org wiki Web_colors The lines below create a high level header centered on the page It is very common to show the page title in this way center font size 5 b INS...

Page 249: ... deleting them from the source code p font size 1 a href http education ti com educationportal preference selectCountry do Texas Instruments Education Technology a br a href http education ti com calculators timathnspired MathNspired c om a br font p Insert an email link Remove comment tags from the line below then type your email after mailto a href mailto username yourserver com E mail the autho...

Page 250: ...ow the snippet may look when you copy it and open it in a text editor 3 Edit the code snippet if needed START TI Nspire TM Document Player Paste the code below into the body of an existing web page or blog The code will generate an HTML iframe when the page is loaded Note the nspirefile parameter holds the location and file name of the TI Nspire TM or PublishView TM document that is to be shown on...

Page 251: ... a code snippet into an existing web page blog online course page or other compatible container Storing documents to be shared online When you create an page using the TI Nspire export functions a window is embedded in the web page The documents and the TI Nspire Document Player themselves are not embedded in the page The code loads the document and the TI Nspire Document Player from whereever the...

Page 252: ...y the code 4 Replace the parameter by pasting the new or path over the existing or path name 5 Save the updated file If your shared document is located on a shared network drive the updated might look like this script type text javascript src http education ti com html nspireplayer js ticreateiframe js scri pt script type text javascript tiDeployPlayer tiCreateIframePlayer IFRAME attributes src ht...

Page 253: ...ript type text javascript tiDeployPlayer tiCreateIframePlayer IFRAME attributes src http education ti com go nspireplayer width 640 height 480 scrolling no frameborder 0 TI Nspire TM Document Player parameters nspirefile file P MathDepartment Algebra Lessons myfile tns script iframe src http education ti com go nspireplayer nspirefile http dl dropbox com u 10849702 myfile tns width 360 height 290 ...

Page 254: ...the file on their hard drive then open the document in their web browser or text editor Launching a dedicated TI Nspire Document Player window You can use to add a link to your web page that will launch the TI Nspire Document Player in a dedicated window The example code provided produces a link that launches a document from the Activities Exchange on education ti com in a dedicated window script ...

Page 255: ...browser components surrounding the dedicated window a href javascript void 0 onclick window open http education ti com go nspireplayer nspirefi le http education ti com xchange US Math AlgebraI 11340 From_Ex pressions_to_Equations tns _blank width 800 height 600 directories no location no menubar no resizable yes scrollbars no status no toolbar no return false Click here a ...

Page 256: ...244 Embedding documents in web pages ...

Page 257: ...ely changing workspaces If a dialog box awaits a response from you enter your response and then change workspaces  Class Workspace toolbar Shows frequently performed tasks Each of these are explained in more detail in Using menus and toolbar icons later in this chapter à Class Record Document actions are shown here You can open a document in the Review workspace save a document to the Portfolio w...

Page 258: ...ntly logged into class and how many students are assigned to the current class If class is not in session the student login status shows Class not started Student view lets you view the current classroom in the seating chart view or the seating list view The seating chart view shows your students as student icons with display names The student list view shows your students in a table that contains...

Page 259: ...dding classes and click Finish when you are done Importing students When you add a class you can import a list of students into the class You must import students while you are adding classes in the Add Class dialog box Note You can always add individual students to any class at any time See Adding students to classes later in this chapter You can import a comma separated value CSV file or a txt f...

Page 260: ...rt Students The Open dialog box opens 3 Select the file that contains the students you want to import 4 Click Open The Import Status dialog box opens telling you how many students the TI Nspire Navigator Teacher Software successfully imported 5 Click OK Note If some students did not import successfully click View Details to determine the problem ...

Page 261: ...asses After you create your classes you need to add students to the classes You can add students to an active class session or you can add students to any class at any time If this is your first time using the TI Nspire Navigator Teacher Software the classroom area may be empty The software prompts you to add a class and to add students to the class You can click the prompt in the classroom area t...

Page 262: ...ou want your student to create their own password select Student Chooses or If you want to create a password for your student select the blank password entry box and enter a new password 6 Optional Enter a display name Note If you leave the display name blank the TI Nspire Navigator Teacher Software uses the student s first name as the display name 7 Optional Enter a student ID 8 Optional Assign t...

Page 263: ...ware only removes them from the selected class If the students are in other classes they remain in those classes until you remove them Notes You cannot remove students who are logged in to the TI Nspire Navigator network You cannot undo the removal of students You can access many of the student account items by right clicking the student icon in the classroom area and choosing an action from the m...

Page 264: ...s you want to begin 3 Click Begin Class Pausing a class session There are times you may want to pause a class Pausing a class suspends all activity on the student s handhelds and they receive a message telling them class is paused When you resume class the message clears and the students are able to use their handhelds The students remain logged in when you pause a class To pause a class in sessio...

Page 265: ...ains their display names first name last name user name and student ID The Seating Chart view shows your students as student icons with display names You can change the class view at any time Changing the class view to Student List Click View Student List or click in the status bar The view changes to Student List Changing the class view to Seating Chart Click View Seating Chart or click in the st...

Page 266: ...udent s icon to the location that you want The TI Nspire Navigator Teacher Software moves the student icons to the new locations The software rememebers the student positions the next time you start the same class Note Do not place one student s icon on top of another students icon If you do this you will only be able to see one of the student s icons Checking student login status The TI Nspire Na...

Page 267: ...sion running you must end it to select the class 2 In the menu click View Student List 3 Click the column title of the list you want to sort The TI Nspire Navigator Teacher Software sorts the selected list 4 If you want to sort the selected information in the opposite order click the column title again Changing the classes assigned to a student Occasionally your students may move to a different cl...

Page 268: ...k Assign Classes The Assign Classes dialog box opens 5 Select the check boxes of the student s classes 6 Clear the check boxes of the classes to which the student does not belong 7 Click OK 8 In the Student Properties dialog box click OK ...

Page 269: ... to change any of these types of names and identifiers Note You cannot change the account information of students who are logged in to the TI Nspire Navigator network Note You can access many of the student account items by right clicking the student and choosing an action from the menu Changing a student s names or identifiers 1 Select a class to which the student belongs Note If you have a class...

Page 270: ... can move them within the TI Nspire Navigator Teacher Software as well Note You cannot move students who are logged in to the TI Nspire Navigator network Note You can access many of the student account items by right clicking the student and choosing an action from the menu Moving a student to another class 1 Select a class to which the student belongs Note If you have a class session running you ...

Page 271: ... entering all of their information again Note You cannot copy students who are logged in to the TI Nspire Navigator network Note You can access many of the student account items by right clicking the student and choosing an action from the menu Copying a student to another class 1 Select a class to which the student belongs Note If you have a class session running you must end it to select the cla...

Page 272: ...ent in the Review workspace save a document to the Portfolio workspace send collect and delete files and view document properties À File action The icons indicate the status of a file as follows Sent to class Collected from class Saved to portfolio Redistributed to class Quick Poll Unprompted À Á Â Ã ...

Page 273: ...ou can send folders and TI Nspire document files tns LearningCheck files edc and CABRI files fig to your whole class members of the class currently logged in or to individual students Class must be in session for you to send files When you send a file to the whole class all students currently logged in will receive the file immediately Students not logged in will receive the file when they log in ...

Page 274: ...rs press and hold the Ctrl key Macintosh while clicking each file name Type the name of the file or folder in the File name or Folder name box Folder names may use alphanumeric characters You can enter slashes and but double slashes and and some special characters are not allowed Note You can also drag and drop files from a file browser window onto the Class Record to send files 4 Click Next The S...

Page 275: ...eld compatible files such as tns files from your students handhelds to your computer Class must be in session for you to collect files If any students are not logged in the files you collect are automatically transferred when they log in You can collect selected files from the Class Record or you can collect recent files that have been sent to the class from the Transfer Tool by using the Tools me...

Page 276: ...The Select file s to collect dialog box opens 2 To choose the files or folders you want to collect do one of the following Click Recent Files and navigate to the file you want to collect and click it To select multiple files or folders press and hold the Ctrl key Macintosh while clicking each file name Click Enter Filename and type the name of the file in the File name box and then click Add 3 Cli...

Page 277: ...e student Note If you had any students selected in the classroom area the software already has them selected 5 If you want to remove the file from the students handhelds after you collect it select Delete from handheld after collecting 6 Click Finish The collected file appears in the Class Record Managing Unprompted actions When a student logged into a class session sends you a file outside of a c...

Page 278: ...rompted dialog you can view one or more items save the items to Portfolio remove the items export the items to another file location or do nothing Viewing items in an Unprompted action 1 From the Unprompted dialog click on the checkbox to the left of the item s you want to view Note You can also click on the View icon beside an item to quickly access the item 2 Click View The items open as read on...

Page 279: ... A file browser opens 4 Select the location for the export 5 Click Select Folder Saving files to a Portfolio record You can save collected unprompted and Quick Poll files to a Portfolio record 1 From the Class Record select the files 2 Click and select Save selected to Portfolio The Save to Portfolio dialog opens 3 Select to save the files to a new Portfolio column or add them to an existing Portf...

Page 280: ...ndhelds 1 Click Tools Delete from class or click Delete from class The Select file s to delete dialog box opens 2 To choose the files you want to delete do one of the following Click Recent Files and navigate to the file you want to delete and click it To select multiple files or folders press and hold the Ctrl key Macintosh while clicking each file name Click Enter Filename and type the name of t...

Page 281: ...ou had any students selected in the classroom area the software already has them selected 5 Click Finish The file deletion appears in the Class Record Checking the status of file transfers When you are sending or collecting files you may want to check to see which of your students have received or sent their files 1 In the Class Record click the file whose status you want to check In the classroom...

Page 282: ... to cancel 2 Click Tools Delete from Class The TI Nspire Navigator software asks if you re sure you want to remove the action 3 Click Delete The TI Nspire Navigator software stops the file transfer and removes the file from the Class Record list Deleting items from the Class Record The Class Record maintains a list of all of the actions you have performed in your class Items remain in this list un...

Page 283: ...s Resetting student passwords The TI Nspire Navigator Teacher Software maintains the privacy of your students passwords Because of this you cannot retrieve passwords for your students if they forget them However if necessary you can reset your students passwords You can reset passwords for all of the students in a class or for individual students Note You cannot reset the passwords of students who...

Page 284: ...ight click the student and choose Edit Student from the menu The Student Properties dialog box opens 3 Click the Reset button next to Password 4 If you want the student to create his or her own password select Student Chooses or If you want to create a specific password for the student select the blank password entry box and enter a new password 5 Click OK The TI Nspire Navigator Teacher Software ...

Page 285: ...e Selected to Portfolio Saves a selected Quick Poll or collected file in the Portfolio workspace Collect Selected from Class Collects a sent or redistributed file selected in the Class Record from all students in class Class must be in session Redistribute Selected to Class Sends a previously collected file to all students in the class Class must be in session Send Missing Sends files or lesson bu...

Page 286: ... Cut Cut selected information Cut copies the content to the computer s clipboard Windows Ctrl X Macintosh X Copy Copies the selected information Windows Ctrl C Macintosh ì C Paste Inserts content either cut or copied at a chosen location Windows Ctrl V Macintosh ì V Remove from Class Record Removes a selected item from the Class Record View Seating Chart Changes the view in the classroom area to S...

Page 287: ...ol that allows you to delete all folders and files at once for the entire class or for selected students Class must be in session Quick Poll Opens a tool that allows you to send a quick poll to students with connected handhelds Windows Ctrl Alt Q Macintosh ì Alt Q Live Presenter Opens a tool that lets you display your handheld screen or a student s handheld screen and record their actions See Live...

Page 288: ...r Opens a tool that lets you check the status of wireless adapters and cradles and lets you add or remove wireless adapters cradles and access points from the classroom system Class Select Class 8 Displays a list of available classes for you to select Begin End Class Begins a class sesion If a class session is currently running ends the class session Pause Resume Class Pauses a class session If a ...

Page 289: ...ot be in session Reset Student Passwords Resets the passwords for all selected students who are not logged in Student Name Format 8 Allows you to choose how student names are displayed either by Last Name First Name User Name Display Name Student ID or hidden Window Reset Workspace Layout Returns your workspace to its original layout Content Workspace Opens the Content Workspace in the TI Nspire N...

Page 290: ...e Navigator Teacher Software Use this workspace to review or document a Quck Poll manage student responses and organize data Windows Ctrl Alt 4 Macintosh ì Alt 4 Portfolio Workspace Opens the Portfolio Workspace in the TI Nspire Navigator Teacher Software Use this workspace to save store review and manage class assignments from students Windows Ctrl Alt 5 Macintosh ì Alt 5 Page Capture Window Open...

Page 291: ...isit education ti com When connected to the Internet opens the Texas Instruments Education Technology site Visit Activities Exchange When connected to the Internet opens the Activities Exchange site Explore Online Troubleshooting When connected to the Internet opens the online troubleshooting site Run TI Nspire Diagnostics Run diagnostics and send a report to TI support Check for Software Updates ...

Page 292: ...280 Using the Class Workspace Welcome Screen Opens the Welcome Screen which gives you quick links to content Toolbar icon Menu option and what you can do Keyboard shortcut ...

Page 293: ...naffected by the presentation and can be used Before starting Live Presenter Live Presenter is accessible from the Class workspace To use Live Presenter Ensure student handhelds are connected Begin a class Ensure students are logged in Starting Live Presenter Make sure the student selected to be the presenter is logged into an active class session Although only one person can present at a time you...

Page 294: ...s window To select all students in the class click 3 Click OK The Class Screen Capture window opens 4 Select a student who is logged in then click The Class Screen Capture window opens in Live Presenter mode By default the window opens in full screen view Use the minimize and maximize buttons in the upper right corner to adjust the size of the window Exploring Live Presenter mode By default Live P...

Page 295: ... bar Only tools applicable to Live Presenter are selectable In Live Presenter you can Click to stop Live Presenter Select to show student names or deselect to hide student names  Handheld pane Displays the presenter s handheld type As the presenter presses keys on their handheld the keys in the display turn red so viewers can follow along The last key pressed remains highlighted until a different...

Page 296: ...the handheld pane When you hide the handheld the Keypress History is shown in this pane Select to show the Keypress History pane Deselect to hide the Keypress History pane Note To view only the handheld screen deselect and Å Keypress History pane As the presenter presses keys on their handheld the keypress sequence is shown left to right Note If the handheld is hidden the keys pressed are shown in...

Page 297: ...rt Live Presenter Showing the handheld enables the class to see which keys are pressed during the presentation When the handheld is shown The key turns red in the display so that the class can follow along when the presenter presses a key The last key pressed remains highlighted until a different key is pressed The keys on the handheld display are not pressable or clickable This visual display onl...

Page 298: ... keys are pressed during the live presentation they appear in the Keypress History pane As keys are pressed they are displayed from left to right then top to bottom If the presenter presses the same key more than once each repeated key press is shown in the Keypress History pane If the presenter presses and holds one key as when moving the cursor then the key is recorded only one time You can copy...

Page 299: ...loses Showing Keypress History If the Keypress History pane is hidden click the check box to select Show Keypress History If the handheld is shown the Keypress History pane opens below the presenter s handheld screen If the handheld is hidden the Keypress History is displayed in the pane to the left of the presenter s handheld screen Copying Keypress History You can copy the keys captured in the K...

Page 300: ...lear the Keypress History pane Select View Live Presenter Clear Keypress History The keys displayed in the Keypress History pane are removed Showing the handheld screen only To show only the presenter s handheld screen during the Live Presenter session Deselect the Show Handheld and the Show Keypress History options The Handheld and Keypress History panes close and the handheld screen is displayed...

Page 301: ... Audio Video Interleave file extension Starting the recording Click or select View Live Presenter Start Recording Recording begins When clicked the button changes to Stop Recording All of the presenter s work on the handheld screen is recorded until you stop the recording Stopping and saving the recording Complete the following steps to stop the recording and save the movie file 1 Click or select ...

Page 302: ...mail attachment To play the recording on your computer 1 Using your file browser navigate to the folder where you saved the presentation avi file 2 Double click the avi file name Your default media player opens and the movie plays Note If the avi file format is not compatible with your default player an error message is displayed Stopping Live Presenter To stop Live Presenter click or select View ...

Page 303: ...on application is located on the Insert menu on the Documents workspace À Tool Palette icon Click this icon to open the Tool Palette Á Tool Palette Provides a menu of tools available for working with an application The tools are specific to the active application  Configuration tool Allows you to set certain properties for each question you insert à Question area This is where you type questions ...

Page 304: ... Correct Answer field Each question type has a unique set of options The configuration settings are retained when you copy and paste a question from one document to another Adding configuration options 1 Click the down arrow on the configuration bar in the Documents Toolbox to open the configuration tool Tool name Tool function Clear Answers Lets the teacher or student clear the answers in the cur...

Page 305: ...e the document Using the Teacher Tool Palette The Teacher Tool Palette allows you to add copyright information and set the document type as Self Check or Exam Adding copyright information Use the Question Properties dialog box to add copyright information on the current question 1 Click the Teacher Tool Palette icon Question Properties The Question Properties dialog box opens Click to open the con...

Page 306: ...e Question Properties dialog to define the document type as Self Check or Exam Note When you define a document as Self Check or Exam all of the question items in that document will be either Self Check or Exam When you define the document type as Self Check students can see the answer and check their work In Exam mode when you enter a suggested response to a question students cannot see the answer...

Page 307: ...a handheld screen On a handheld you may have to scroll to view the entire image Adding images using the clipboard Copy an image to the clipboard from a TI Nspire document image file or another program using Ctrl C Mac C Paste the image into the question using Ctrl V Mac V Adding questions You can add the following types of questions Multiple Choice Custom ABCD True False Yes No Always Sometimes Ne...

Page 308: ...color tool Adding a custom multiple choice question Adding a custom choice question allows you to specify answers your students can select You can then select one or more responses as correct to help you when grading or to help students check questions that are in Self Check mode To add a custom multiple choice question 1 Click Insert Question 2 Select Custom under the Multiple Choice question fro...

Page 309: ...u can add an image in the question text area 5 Press Enter to add another question line or Tab to go to the first Correct Answer radio button 6 Type the response options Add an image if desired 7 Press Enter to add other response options and add the response text Press Delete to edit or delete a response Use the Backspace key to delete an empty response line 8 Click the radio button next to a sugg...

Page 310: ... 1 Click Insert Question 2 Select Explanation under the Open Response question from the Choose Question Type dialog box 3 Click Insert to insert the selected question type The Open Response template opens with the Question toolbar visible The cursor is in the Question text area À Question text area Write your question here Á Student answer area Leave this field blank The answer your student has gi...

Page 311: ...lization is not important You can type any combination of text and math expressions in the Response area Adding an equation question An equation question prompts the student to write an equation in the form of y or f x This example shows how to add a y question To add an equation question 1 Click Insert Question 2 Select y under the Equation question from the Choose Question Type dialog box 3 Clic...

Page 312: ...l show in the Question area The number of responses can range from 1 to 5 You can add additional fields for multiple correct answers For example you might want to accept both y x 1 x 2 and y x 2 x 1 as correct answers You can type any combination of text and math expressions in the correct answer fields The Show your work option includes areas for the students to write their starting point their s...

Page 313: ...ed question type The list template opens with the Question toolbar visible The cursor is in the Question text area 4 Type the question You can type any combination of text and math expressions in the Question Text area You can add an image in the Question Area Use the Tab key or mouse pointer to navigate between fields 5 Enter a suggested response if desired The response fields are expression boxe...

Page 314: ...ressions To add a graph in the Question area check the box to Include a Graph Preview The Question text area splits to show a graph on the right When you are in the graph the Graphs Geometry toolbar is available to allow you to add functions Note Only the teacher can manipulate the graph Students can only view and zoom the graph Adding a drop points question À Question text area Write your questio...

Page 315: ...ombination of text and math expressions in the Question Text area You can add an image in the Question Area Use the Tab key or mouse pointer to navigate between fields 5 Open the configuration tool to set the number of points hide or show coordinates and enter a correct answer The number of points can range from 1 to 5 Showing coordinates is turned off by default Check the box to display coordinat...

Page 316: ...Click Insert to insert the selected question type The list template opens with the Question toolbar visible The cursor is in the Question text area 4 Type the question You can add columns or rows change the name of the lists and input data in the lists using the same functions allowed in the Lists Spreadsheet application 5 Enter initial data in the lists if desired 6 Open the configuration tool to...

Page 317: ...he following methods Software In the Documents Toolbar click the Tool Palette icon Handheld When in the question click b Understanding the Question toolbar When you open documents containing questions the Question toolbar displays four available tools Tool name Tool function Clear Answers Lets you clear the answers in the current question or in the document Check Answer If your document is in Self...

Page 318: ... questions There are several types of questions you may be asked The following is a list of the types There may be variations in a type but how you answer the question is basically the same for each type Multiple choice Custom ABCD True False Yes No Always Sometimes Never Agree Disagree Strongly Agree Strongly Disagree Open response Explanation Text match Equation y f x Coordinate points and list ...

Page 319: ...horizontal bar then the area for you to insert your answer Some question types have slightly different answer areas See the rest of this section s images for these differences Checking your Answer If your question is self checking you will see the Check Answer option available If not it will be grayed out Software Select the Tool Palette icon Handheld Click b ...

Page 320: ...the question use your mouse to select the answer Handhelds You can use the touch pad as you would a mouse Alternately you can press e to navigate to your question and then press Example of multiple choice questions with boxes 1 and option 2 buttons Note Here are a few other examples illustrated in the preceding image In the first example because there are more choices than what is seen on the scre...

Page 321: ...s 15 because the value of Y is 12 This would be counted wrong because it is not an exact match with the answer key Note The teacher may decide to ignore the the text capitialization Equation y and f x When you receive a equation question it will be a y or f x option Both of these forms work the same Enter your answer in the box provided Note When answering a question spaces upper and lowercase dif...

Page 322: ...tilities icon software or handheld t 2 Select the correct format in the example above the fraction format is used Double click in the software to select or press on handheld 3 Enter the values Tab to go to the next value or to escape the math format box Example using handheld Software See the next example for more detail with the software 1 2 3 ...

Page 323: ...can use the Utility function to enter math formats Note To enter math formats you can use the Utility function 1 Click the Utilities icon software or handheld t 2 Select the correct format in this example the fraction format Double click in software to select or press on handheld 3 Enter the values Tab to go to the next value or to escape the math format box Example user software Handheld See the ...

Page 324: ...h you will see the cursor looks like a pencil This indicates you can place the point Placing the point Move the cursor to where you want to place a point and click to drop Note When the question is presented to you with a grid background you can place the point at any location but once you have placed it on one of the grid points it will always snap to the grid when moving After it has been placed...

Page 325: ...oint 3 Press the select key aagain to deselect Removing a point To remove a point once placed in the graph pane Software Ctrl Z or Edit Undo to clear the last action or Click Menu Clear Answers Current Question You can also click Menu Clear Answers Document if you want to clear all answers in the entire document Handheld Click b Clear Answers Current Question You can also click b Clear Answers Doc...

Page 326: ...314 Using Question for Students List s You can answer list questions simply by putting values into cells in the correct columns ...

Page 327: ...to know to use the Quick Poll tool in your class Quick Poll is available from all workspaces When you open the Quick Poll tool the software automatically changes to the Documents workspace All Quick Polls for one class session are contained in one tab in the Documents workspace Note A new tab is started when a poll exceeds 15 questions or when you start a new class session When you start the poll ...

Page 328: ...the question is displayed at the bottom of the Choose Question Type dialog box Opening the Quick Poll tool You can open the Quick Poll tool from any workspace of the TI Nspire Navigator Teacher software You can send a poll from an existing document or open a new document to start a poll Before you begin make sure a class is in session 1 Click Tools Quick Poll or click Quick Poll The software opens...

Page 329: ...nd click Insert A new document opens with the question template open and the cursor in the Question text area Note For detailed information about each question type and how to create and configure questions see Using Question in the Teacher Software ...

Page 330: ...ols menu Use these options for the active Quick Poll session Allow Document Access Allows you to grant or deny students access to the Scratchpad and any documents on their handheld The students may access a document do some math and copy the results back into the poll Note If a data collection sensor is attached to the computer or handheld during a Quick Poll that does not have Allow Document Acce...

Page 331: ...o Portfolio or click Note After the first save subsequent changes to the poll are automatically updated in Portfolio until you stop the poll Viewing poll results You review Quick Poll results in the Review workspace Polls sent in one class session are contained in a Quick Poll tab in the Review workspace Each new question is added as a new problem in the page sorter and the software automatically ...

Page 332: ...320 Polling students For detailed information on viewing and sorting poll results see Using the Review Workspace ...

Page 333: ...s other features of your handheld while in the Quick Poll screen do this 1 Press c to access the Home menu Choose your desired application from this menu Note To return to the Quick Poll without accessing any documents choose C Quick Poll 2 When you are finished click the Quick Poll icon on the top of the handheld screen to return to the Quick Poll tool Responding to Quick Poll questions To submit...

Page 334: ...ve the cursor to the x field answer box Type your answer and press e to move to the y field box Type your answer If a graph is included with the question when you press the function you entered shows up on the graph You can use b to access the Window and Zoom functions while you are working on the graph For Coordinate Points Drop Points questions press e to move the cursor to a point on the graph ...

Page 335: ...e time to clear your answer before you submit it to your teacher Press and choose 2 Clear Answer to clear your answer and try again Submitting Quick Poll responses When you have finished answering the Quick Poll question send your answer to the teacher Press and choose 1 Submit Answer to send your answer to the teacher Note Choose 2 Clear Answer to clear your answer and try again Your handheld sen...

Page 336: ...324 Polling students ...

Page 337: ...workspace Each of these are explained in more detail in Using menus and toolbar icons later in this chapter à Review toolbox Contains the Review Tools Page Sorter and Student response tools Click each icon to access the available tools Options for the selected tool are displayed in the toolbox pane Ä Class session controls Choose a class from a list of available classes You can begin pause resume ...

Page 338: ...graph views are explained in more detail later in this chapter À Network status Shows how many TI Nspire CX Wireless Network Adapters and TI Nspire Navigator wireless cradles are currently connected to the system You can click here to launch the Network Manager window Á Student login status The student login status shows how many students are currently logged into class and how many students are a...

Page 339: ... selected answers as correct Mark selected answers as incorrect À Organize Click to organize the data in different views Icon What you can do Review tools The Review tools let you organize the response data use graph tools hide or show responses and mark Question and Quick Poll responses as correct or incorrect Page sorter Displays all the problems in a document all the pages in each problem and t...

Page 340: ...e correct answer You can mark more than one answer as a correct answer Å Mark Selected Incorrect Select a response from the Data View pane and click Mark Selected Incorrect to mark that response as an incorrect answer You can mark more than one answer as an incorrect answer Exploring the Page sorter Use the Page Sorter to display the pages in a document and view student responses to any questions ...

Page 341: ...their answer In the example below 9 students are in the class 7 students have received and responded to the poll and no students have submitted their answer yet à Scroll bar The scroll bar is active when there are too many pages to show in the panel Ä Page numbers Click on a page number to open the page in the Data View pane Exploring the Student pane Use the Student pane to Display the students t...

Page 342: ...erical order Click again to list the responses in reverse order To add the Time tab in Quick Poll reviews click the Options menu and choose Time Click on the Time tab to list the responses in order of the time they were answered first response on top Click again to list the responses with the first response on the bottom  Student names Lists all students in the class associated with the document ...

Page 343: ...tudent responded and the responses are hidden No Response displays if the student has not yet responded to the open question or active Quick Poll Working displays if the student has modified their response to a Quick Poll but has not submitted it Ä Options menu Click to open the drop down menu of options you can perform on the student responses Display student responses Display student names only ...

Page 344: ... Data View The Data View pane displays the question of the open document as well as the responses to that question You can view live results in the Data View pane The data updates as students respond to Quick Poll questions graph functions or move points on a graph The Data View icons allow you to view responses in the Data View pane as a bar chart graph or table Each view displays the student res...

Page 345: ...Click to view the data in bar chart form Click to view the data in graph form When you are in graph view the Graph Tools are available to allow you to work with the graph In the bar chart and graph views you can let your mouse pointer hover over a response to see a list of students who gave that response ...

Page 346: ...hows the responses with the number of times the response occurred You can click the Response tab to sort the responses in ascending order descending order or question order Click the Frequency tab to sort by frequency of response A student table shows the student names with their responses You can click the Student tab to sort the responses in ascending or descending alphabetical order Click the R...

Page 347: ... students are responding When you stop and save the poll you can open it in the Review workspace to review the saved responses If this is your first time using the TI Nspire Navigator Teacher Software the Data View pane area may be empty Follow the steps below to open a document for review Opening a document from the Class workspace To open a document for review from the Class workspace follow the...

Page 348: ...eview from the Portfolio workspace follow these steps 1 Use the Workspace selector to select the Portfolio workspace 2 Right click on a column cell or a cell in a student s row and select Open in Review workspace The software automatically switches to the Review workspace with the selected document open ...

Page 349: ...highlights the selected student s answer in blue If you switch between bar chart table and graph views the software retains the selected information and highlights the responses from the selected students Note Since student responses can vary for List questions the software does not display List answers for selected students in the Data View pane Viewing data from the Data View pane Select a respo...

Page 350: ...n and highlights the students who answered the selected response Note Multiple Choice questions with multiple responses display a blue area next to all responses from the selected student Note For List questions right click anywhere in the table view and choose Show Student Column to display student names next to their responses ...

Page 351: ...gs let you set different shapes for the different plots that can help you follow separate lines or responses on a graph To set the plot list settings follow these steps 1 While in graph view Click Graph Tools in the Review toolbox 2 Select Plot List Settings The Configure Plot s dialog box displays 3 Choose which shape you want to represent the xList and yList and click the down arrow next to that...

Page 352: ...Cancel the software displays the bar chart as an individual list using list1 as the default You can configure the plot list at any time while in bar chart view To configure the plot list from the bar chart view click Organize in the Review toolbox and select Plot List Settings Individualizing student responses You can change the colors of each student s response in a graph so you can identify the ...

Page 353: ...r 2 Select to sort the bars by Frequency Numeric Value or Alphabetically The bar chart view updates in the Data View pane Organizing bar chart data Organizing by separate responses shows the results for each individual response For example all of the A responses all of the Bs all of the Cs and so forth Organizing by group responses shows all multiple responses from the students For example all of ...

Page 354: ...grouped responses follow these steps 1 Click the Organize tool in the Review toolbox 2 Select Show Student Responses Grouped Together The Data View pane displays the grouped responses To return to the default view click the Organize tool and select Show Student Responses Separated The Data View pane displays the data as separate responses ...

Page 355: ...he Review toolbox 2 Select Form Bars by Equivalence The Data View pane displays the grouped responses To return to the default view click the Organize tool and select Form Bars by Exact Matches The Data View pane displays the data as separate responses Hiding and showing responses You can hide one or more selected students responses from the Student pane or from the Data View pane When you hide a ...

Page 356: ...lays the new values Show your work The selected student s work is hidden from view Hiding responses from the Student pane To hide responses follow these steps 1 In the Student pane select the students whose responses you want to hide The selected students responses are highlighted in blue in the Data View pane 2 Click the Options menu and choose Hide Selected or uncheck the check box next to the s...

Page 357: ...ses from the Data View pane You can hide responses from the bar chart graph or table views When you hide responses the Data View pane updates the data and does not show the hidden responses If you are in the Student View the student names are displayed in gray If you are in the Page Sorter view the software does not change the documents or icons To hide responses follow these steps 1 In the Data V...

Page 358: ...udents The student names that correspond with the responses you selected are displayed in gray text Showing responses To show the hidden responses follow these steps 1 In the Student pane select the students whose responses you want to show 2 Click the Options menu and choose Show Selected The student names display in black and the Data View pane displays the student responses ...

Page 359: ...In the Data View pane select a response and choose Mark Selected Correct in the Review Tools pane In Multiple Choice questions with multiple answers check marks display next to the responses Click a check mark to mark a response as correct When you mark a response as incorrect the software removes the green highlight To mark a response as incorrect In the Student pane right click a student and cho...

Page 360: ...leaves the question with no correct answers Equation f x and y Adding a new answer increases the correct answer set Removing an answer decreases the correct answer set Coordinate points Adding a new answer increases the correct answer set Removing an answer decreases the correct answer set The examples below show answers marked as correct in different data views Bar chart view Multiple Choice ques...

Page 361: ...nd two correct answers organized by Show Student Responses Separate and one student selected in the Student pane Bar chart view Multiple Choice question with multiple responses and two correct answers organized by Show Student Responses Grouped Together and no students selected in the Student pane ...

Page 362: ...ganized by Show Student Responses Grouped Together and one student selected in the Student pane Frequency table view Multiple Choice question with one correct answer and no student selected in the Student pane Student table view Multiple Choice question with one correct answer and one student selected in the Student pane ...

Page 363: ... and teacher equations to a graph and to set the plot list settings and individualize the student responses Teacher data is displayed larger than the students data and in a different color Graph view Equation y question with one correct answer and no student selected in the Student pane Graph view Equation y question with one correct answer and one student selected in the Student pane ...

Page 364: ...not mark the teacher s response as correct or incorrect Adding teacher points 1 Click Graph Tools in the Review toolbox 2 Select Add Teacher Point 3 The Add Teacher Point dialog box displays 4 Enter your information in the fields Click to open math templates and symbols that you can add to the fields 5 Click OK Your point displays on the graph and the name Teacher is added to the names in the Stud...

Page 365: ...box 2 Select Add Teacher Equation 3 The Add Teacher Equation dialog box displays 4 Enter your information in the field Click to open math templates and symbols that you can add to the fields 5 Click OK Your line displays on the graph and the name Teacher is added to the names in the Student pane ...

Page 366: ...es not ask you for a file name The software saves the file to Portfolio with the existing file name and updates any grades you had given students You can go to the Portfolio workspace and change a grade at any time To save a file to the Portfolio workspace follow these steps 1 Click File Save to Portfolio or click The Save to Portfolio dialog box opens with the name of the file filled in the Portf...

Page 367: ...Windows Ctrl S Macintosh S Close Closes the current document Windows Ctrl W Macintosh W Start Stop Quick Poll Starts a poll if a question document is open and a class is in session Stops a poll if one is currently active Settings 8 Opens a dialog box that lets you change language and set or change your teacher preferences Change Language 8 Select a different language Exit Closes all applications w...

Page 368: ...w pane in bar chart graph or table views Only available from the student response views in the Analysis pane Bar Chart Displays responses in the Data View pane as a bar chart Coordinate Graph Displays responses in the Data View pane as a coordinate graph if applicable Table DIsplays responses in the Data View pane as a table Show Your Work Displays student s work in the Data View pane if that opti...

Page 369: ...ds or the entire class in the active class session The captured images are located in the Class Capture tool Transfer Tool Opens a tool that allows you to send files to multiple students at once Windows Ctrl T Macintosh ì T Network Manager Opens a tool that lets you check the status of wireless adapters and cradles and lets you add or remove wireless adapters cradles and access points from the cla...

Page 370: ...Navigator Teacher Software Use this workspace to manage content from your computer links to websites connected handhelds or Texas Instruments web content Windows Ctrl Alt 1 Macintosh ì Alt 1 Class Workspace Opens the Class Workspace in the TI Nspire Navigator Teacher Software Use this workspace to manage classes and students use the class record panel exchange files with students and monitor docum...

Page 371: ... Review Tools in the toolbox pane Page Sorter Opens the Page Sorter in the toolbox pane Students Opens the Student Response pane in the toolbox pane Autohide Review Toolbox Hides the Review Toolbox and toolbox pane Class Screen Capture Window Opens the TI Nspire Screen Capture tool where you can view page captures and selected handheld screen captures DocumentName tns Lists the names of open docum...

Page 372: ...Visit education ti com When connected to the Internet opens the Texas Instruments Education Technology site Visit Activities Exchange When connected to the Internet opens the Activities Exchange site Explore Online Troubleshooting When connected to the Internet opens the online troubleshooting site Run TI Nspire Diagnostics Run diagnostics and send a report to TI support Check for Software Updates...

Page 373: ...Using the Review Workspace 361 Welcome Screen Opens the Welcome Screen which gives you quick links to content Toolbar icon Menu option and what you can do Keyboard shortcut ...

Page 374: ...362 Using the Review Workspace ...

Page 375: ...ing menus and toolbar icons later in this chapter à Assignments pane Select assignments here to view the students and the scores in the Workspace From here you can redistribute rename or remove an assignment Ä Class session controls Choose a class from a list of available classes You can begin pause resume or end a class Å Workspace Shows the list of students in the selected class and the scores t...

Page 376: ...and how many students are assigned to the current class If class is not in session the student login status shows Class not started Exploring the Assignments pane À Assignments Summary Lists the names of the assignments that you have saved to the Portfolio workspace Shows a class and student average in the Workspace Click the minus sign to collapse the list of individual assignments and view only ...

Page 377: ...ignments Summary View This Workspace view displays when you have Assignments Summary selected in the Assignments pane À Column Actions Lets you perform certain actions on a column Clicking a file icon on this row allows you to Open in the Review Workspace Open for Editing Select Column Sort Ascending or Descending Send Missing Collect Missing Redistribute to Class Open Master Document Remove from ...

Page 378: ... file types shown are Quick Poll and tns files Æ Student scores If a question is automatically graded the scores display here You can change a student s score for an assignment Individual Assignment View This Workspace view displays when you have a single assignment selected in the Assignments pane À Name of the selected assignment Á Total Possible This row shows the points for these categories To...

Page 379: ...ere are more questions in the assignment to view or more students to view Saving an item to the Portfolio workspace If this is your first time using the TI Nspire Navigator Teacher Software the Portfolio workspace may be empty You need to save files to the Portfolio workspace in order to view and edit scores and perform other work on the files You can save collected unprompted and Quick Poll files...

Page 380: ...new name To save the files to an existing Portfolio column click Add to existing portfolio column Click the drop down arrow to select the desired column Note Quick Polls can not be added to existing columns 3 Click Save The file is saved in the Portfolio workspace Note The files you have saved in Portfolio remain in the Class Record until you remove them using the Remove command If a file is delet...

Page 381: ...tudent has entered Fall If you want to give the student full or partial credit you can do so by changing the student s score for the question In addition to editing an individual student s score you can edit the total possible points for each question the extra points and the final percentage Use whole numbers to edit the scores For example type 75 to give a score of 75 type 100 to give a score of...

Page 382: ...hout making changes click Leave student assigned credit for this question intact To reassess the score for each student click Reassess question for each student Note If you are editing a file that is open in another workspace the file does not automatically update in the other workspace You need to close the file and reopen it to see the changes you made 4 Click OK Changing the final percentage sc...

Page 383: ...e Export The software prompts you for an export location The default location is the My Documents folder The default name is the name of the assignment 3 Navigate to the location you want to save the file 4 Click Save The csv file contains all the columns and rows in the workspace except for the Column Actions row If a student had an empty cell with no score the cvs file displays No score for that...

Page 384: ...Individual Assignments view select a cell in the selected student s row 2 Click File Open for Editing or right click and select Open for Editing The software opens the item in the Documents workspace Opening an item in the Review workspace 1 Select the tns or Quick Poll file you want to open using one of these methods From the Assignments Summary list select the file From the Workspace in the Assi...

Page 385: ...s a read only file Adding a Master Document There may be times when you want to replace an existing Master Document or add a Master Document to an assignment that does not have one For example a question was marked with an incorrect answer and the students did not receive credit for that answer You can give the students credit by changing the answer to that question and retain the Master Document ...

Page 386: ... additional work Class must be in session to redistribute a file 1 Select the item you want to redistribute 2 Right click and select Redistribute to Class or click The system sends the file to each student logged onto the TI Nspire Navigator network Collecting missing files from students There may be times when you store a set of student files to the Portfolio workspace and the collection is incom...

Page 387: ...a Portfolio item You can rename an assignment from the Assignments pane or from the column header 1 Select the assignment name or column header you want to rename 2 Right click and select Rename The system displays the Rename Portfolio Column dialog box 3 Type the new name and click Rename Click Cancel to cancel the request The column appears in the column header and in the Assignments pane with t...

Page 388: ...eyboard shortcut Toolbar icon Menu option and what you can do Keyboard shortcut File Open in Review Workspace Opens a selected Quick Poll or tns file in the Review workspace Open for Editing Opens a selected tns file in the Documents workspace Redistribute to Class Sends a previously collected file to all students in the class Class must be in session Open Master Document Opens the Master Document...

Page 389: ...ge language Change Language 8 Select a different language Exit Closes all applications with a prompt to save the current document Windows Alt F4 Macintosh ì Q Edit Undo Undo the last action performed Windows Ctrl Z Macintosh Z Redo Reverses the Undo action Windows Ctrl Y Macintosh Y Cut Cut selected information Cut copies the content to the computer s clipboard Windows Ctrl X Macintosh X Copy Copi...

Page 390: ...the selected assignment in the workspace Tools Quick Poll Opens a tool that allows you to send a quick poll to students with connected handhelds Windows Ctrl Alt Q Macintosh ì Alt Q Screen Capture 8 Opens a tool that lets you capture the screens of the entire class of connected handhelds Capture Class Captures the screens of selected student handhelds or the entire class in the active class sessio...

Page 391: ...ilable classes for you to select Begin End Class Begins a class sesion If a class session is currently running ends the class session Pause Resume Class Pauses a class session If a class session is paused resumes the class session Reset Student Passwords Resets the passwords for all selected students who are not logged in Student Name Format 8 Allows you to choose how student names are displayed e...

Page 392: ...cuments Workspace in the TI Nspire Navigator Teacher Software Use this workspace to author documents and demonstrate mathematical concepts Windows Ctrl Alt 3 Macintosh ì Alt 3 Review Workspace Opens the Review Workspace in the TI Nspire Navigator Teacher Software Use this workspace to review or document a Quck Poll manage student responses and organize data Windows Ctrl Alt 4 Macintosh ì Alt 4 Por...

Page 393: ...net opens a page where you can register your product Download Latest Guidebook When connected to the Internet opens a page where you can download the latest product guidebooks Visit education ti com When connected to the Internet opens the Texas Instruments Education Technology site Visit Activities Exchange When connected to the Internet opens the Activities Exchange site Explore Online Troublesh...

Page 394: ...are updates Check for Handheld OS Update Is active when a handheld is selected About Displays TI Nspire Navigator product information Welcome Screen Opens the Welcome Screen which gives you quick links to content Toolbar icon Menu option and what you can do Keyboard shortcut ...

Page 395: ...dheld that lets you quickly Evaluate math expressions Graph functions Opening and closing the Scratchpad From the Home screen press to open the Scratchpad The first time you open the Scratchpad a blank page opens with the Calculator active Press to alternate between the Calculate and Graph pages ...

Page 396: ...andard mathematical notation as you enter them Each evaluated expression and result becomes part of the Scratchpad history displayed above the entry line Entering simple math expressions Note To enter a negative number press v and then enter the number Suppose you want to evaluate 1 Select the entry line in the work area 2 Type 2 l 8 to begin the expression 3 Press to return the cursor to the base...

Page 397: ...Inserting items from the Catalog You can use the Catalog to insert functions and commands units symbols and expression templates into the entry line 1 Press k to open the Catalog By default the first tab is displayed which lists all commands and functions in alphabetical order Pressing forces the approximate result Catalog for a non CAS handheld Catalogfor a CAS handheld ...

Page 398: ...he item into the entry line Using an expression template Templates help you enter matrices piecewise functions systems of equations integrals derivatives products and other math expressions For example suppose you want to evaluate 1 Press t to open the Template palette 2 Select to insert the algebraic sum template The template appears on the entry line with small blocks representing elements that ...

Page 399: ...ar regression model to the following two lists 1 2 3 4 5 5 8 11 14 17 1 Press k 1 to open the Catalog and show the alphabetic list of functions 2 Click inside the list and then press L to jump to the entries that begin with L 3 Press as necessary to highlight LinRegMx 4 If the Wizards On option is not checked Press e e to highlight Wizards On press to change the setting then press e e to highlight...

Page 400: ...u want to store the regression equation in a specific variable press e and then replace Save RegEqn To with the name of the variable 10 Select OK to close the wizard and insert the expression into the entry line The expression is inserted along with statements to copy the regression equation and display the variable stat results which will contain the results LinRegMx function in a CAS handheld ...

Page 401: ...lays the stat results variables Note You can copy values from the stat results variables and paste them into the entry line Viewing the history Each evaluated expression and result becomes part of the Scratchpad history displayed above the entry line Press or to scroll through the history À Current entry total entries À ...

Page 402: ...rrent values If you clear the history by mistake use the undo feature From the Actions menu select Clear History Press b 1 5 All expressions and results are removed from the history Editing Scratchpad expressions Although you cannot edit a Scratchpad Calculate expression in the history you can copy all or part of an expression from the history and paste it to the entry line You can then edit the e...

Page 403: ...h Type from the menu and select a graph type For example To graph a scatter plot press b 3 4 Click var to choose variable to plot as x and y for sn To graph a function press b 3 1 The entry line changes to display the expression format for the specified graph type You can specify multiple functions of each graph type 2 Type an expression and any other parameters required for the graph type 3 Press...

Page 404: ...To hide the function table click the graph and then press b 2 5 Changing the appearance of the axes As you work with graphs the Cartesian axes are displayed by default You can change the appearance of the axes in the following ways 1 Press b 4 and choose the Zoom tool to use 2 Select the axes and press b 3 to activate the Attributes tool a Press 9 or to move to the attribute to change For example ...

Page 405: ...gion of the screen until the axes are in the desired location 6 Change the axes scales by pressing b 4 1 Type the values of your choice over the current values for x min x max y min and y max and click OK 7 Press b 2 1 to hide or show the axes If the axes are shown on the page selecting this tool hides them If the axes are hidden on the page selecting this tool redisplays them Tracing a graphed fu...

Page 406: ...ace cursor to that value on the function s graph Create a persistent point that remains on the graph while in Graph Trace mode by pressing when the trace point reaches the point you want to label Trace through and identify the points at which the function has no defined x or y value a discontinuity The string undef displays instead of a value when you move over a point that is not defined for the ...

Page 407: ...ch region 4 Press at the point to start the search The tool shades the range If the search region you specified includes the point of interest a label for the point displays If you change a graph that has points of interest identified be sure to check for changes in points of interest For example if you edit the function on the entry line or manipulate a plot the point where the graph intersects z...

Page 408: ...elect either New or Current document 5 Click Save If you selected to save to an open document the Scratchpad pages are added to the document If you selected to save to a new document Click Yes when the Save dialog box opens Type a name for the document Click Save to save the new document Clearing Scratchpad contents Complete the following steps to delete the calculations and graphing work from the...

Page 409: ...em You can also use Calculator to define library objects such as variables functions and programs which are accessible from any problem of any document For information on creating library objects see the Libraries section of the documentation À Calculator menu This menu is available anytime you are in the Calculator work area using the Normal view mode The menu in this screen snapshot may not exac...

Page 410: ...e Variable Inserts the delVar command Clear a z Deletes all variables with single letter names Clear History Deletes all expressions in the Calculator history Insert Comment Lets you insert text Library Lets you refresh all libraries set LibPub or LibPriv access insert a character or create a library shortcut Lock Inserts Lock unLock or getLockInfo Number Convert to Decimal Inserts Decimal command...

Page 411: ...merical Solve Inserts Solve System of Linear Equations Opens the wizard Polynomial Tools Lets you open the wizard or select or CAS Algebra Solve Inserts solve Factor Inserts factor Expand Inserts expand Zeros Inserts zeros Complete the Square Inserts Numerical Solve Inserts nSolve Solve System of Equations Lets you open the or the wizard Polynomial Tools Lets you open the wizard or select or Fract...

Page 412: ...mplate Sum Inserts the Sum template Product Inserts the Product template Numerical Function Minimum Inserts Numerical Function Maximum Inserts CAS Calculus Derivative Inserts the Derivative template Derivative at a Point Opens the wizard Integral Inserts the Integral template Limit Inserts the Limit template Sum Inserts the Sum template Product Inserts the Product template Function Minimum Inserts...

Page 413: ... randNorm randSamp or RandSeed Distributions Lets you select from several distributions such as Normal Pdf Binomial Cdf and Inverse F Statistics Stat Calculations Lets you select from several statistics calculations such as one variable analysis two variable analysis and regressions Stat Results Inserts the stat results variable List Math Lets you select from several list calculations such as mini...

Page 414: ... wizard or insert or Transpose Inserts T Determinant Inserts det Row Echelon Form Inserts ref Reduced Row Echelon Form Inserts rref Simultaneous Inserts simult Norms Lets you select norm rowNorm or colNorm Dimensions Lets you select dim rowDim or colDim Row Operations Lets you select rowSwap rowAdd mRow or mRowAdd Element Operations Inserts dot operators such as dot add and dot power Advanced Inse...

Page 415: ...Inserts a template for creating a function Prgm EndPrgm Inserts a template for creating a program Local Inserts the Local command Control Lets you select from a list of function and program control templates such as and error handling and warning related items Transfer Inserts transfer commands Return Cycle Exit Lbl Stop or Goto I O Inserts input output commands or Mode Inserts commands for settin...

Page 416: ...on displays in standard mathematical notation and the result displays on the right side of the Calculator Note If a result does not fit on the same line with the expression it displays on the next line Controlling the form of a result You might expect to see a decimal result instead of 2752 3 in the preceding example A close decimal equivalent is 917 33333 but that s only an approximation By defau...

Page 417: ... By changing the document s Auto or Approximate mode setting to Approximate From the File menu select Settings Document Settings Handheld Press 1 7 Note that this method forces all results in all of the document s problems to approximate Inserting items from the Catalog You can use the Catalog to insert system functions and commands symbols and expression templates into the Calculator entry line 1...

Page 418: ...in the list select it and press to insert it 3 If the item is not visible a Click inside the list of functions and then press a letter key to jump to the entries that begin with that letter b Press or as necessary to highlight the item you are inserting Help such as syntax information or a short description of the selected item appears at the bottom of the Catalog c Press to insert the item into t...

Page 419: ...lates Handheld Press t 2 Select to insert the algebraic sum template The template appears on the entry line with small blocks representing elements that you can enter A cursor appears next to one of the elements to show that you can type a value for that element 3 Use the arrow keys to move the cursor to each element s position and type a value or expression for each element 4 Press to evaluate th...

Page 420: ...to the template and press to define the matrix Inserting a row or column into a matrix To insert a new row hold down Alt and press Enter To insert a new column hold down Shift and press Enter Handheld To insert a new row press To insert a new column press g Inserting expressions using a wizard You can use a wizard to simplify entering some expressions The wizard contains labeled boxes to help you ...

Page 421: ...n press e e to highlight LinRegMx again 5 Press A wizard opens giving you a labeled box to type each argument 6 Type 1 2 3 4 5 as X List 7 Press e to move to the Y List box 8 Type 5 8 11 14 17 as Y List 9 If you want to store the regression equation in a specific variable press e and then replace Save RegEqn To with the name of the variable 10 Select OK to close the wizard and insert the expressio...

Page 422: ...owing Define f x y 2 On the Utilities tab click to display the templates Handheld Press t 3 Select The Piecewise Function dialog box displays 4 Type the Number of Function Pieces and select OK Calculator displays a template with spaces for the pieces 5 Type the expressions into the template and press to define the function 6 Enter an expression to evaluate or graph the function For example enter t...

Page 423: ...n type part of an expression leave to check some work you did on another page and then come back to complete the expression later Working with variables When you first store a value in a variable you give the variable a name If the variable does not already exist Calculator creates it If the variable already exists Calculator updates it Variables within a problem are shared by TI Nspire math and s...

Page 424: ..._ CAS Converting between measurement units You can convert a value between any two units within the same category such as length Example Using the Catalog convert 12 meters to feet The desired expression is 12 _m _ft 1 Type 12 on the entry line 2 On the Utilities tab click to display the unit conversions Handheld Press k 3 3 Select the Length category to expand the list of pre defined length units...

Page 425: ...from the Length category and press 8 Press to evaluate the expression CAS Creating a user defined unit As with the pre defined units user defined unit names must begin with an underscore symbol Example Using the pre defined units _ft and _min define a unit named _fpm that lets you enter velocity values in feet per minute and convert velocity results to feet per minute ...

Page 426: ...ne type Define cube x x 3 and press The message Done confirms that the function has been defined 2 Type cube 2 and press to test the function Defining a multiple line function using templates You can define a function consisting of multiple statements entered on separate lines A multiple line function may be easier to read than one with multiple statements separated by colons Note You can create m...

Page 427: ...Func Calculator inserts the template 3 Insert the If Then Else EndIf template From the Functions Programs menu select Control and then select If Then Else EndIf Calculator inserts the template 4 Type the remaining parts of the function using the arrow keys to move the cursor from line to line 5 Press to complete the definition 6 Evaluate g 3 7 to test the function ...

Page 428: ...or entry line type Define sumIntegers x Do not press yet 2 Insert the Func EndFunc template From the Functions Programs menu select Func EndFunc Calculator inserts the template 3 Type the following lines pressing or Alt Enter at the end of each line 4 After typing Return tmpsum press to complete the definition 5 Evaluate sumIntegers 5 to test the function Defining a program Defining a program is s...

Page 429: ...e type Define prog1 x y Do not press yet 2 Insert the Prgm EndPrgm template From the Functions Programs menu select Prgm EndPrgm 3 Insert the If Then Else EndIf template From the Functions Programs menu select Control and then select If Then Else EndIf 4 Type the remaining parts of the function using the arrow keys to move the cursor from line to line Use the Symbol Palette to type the symbol 5 Pr...

Page 430: ...or moves to the closest valid position in the direction that you press Note An expression template may force the cursor to move through its parameters even though some parameters may not be exactly in the path of the cursor movement For example moving upward from the main argument of an integral always moves the cursor to the top limit Inserting into an expression in the entry line 1 Position the ...

Page 431: ...ns such as time value of money amortization calculations and return on investment calculations The Calculator application also includes a Finance Solver It lets you dynamically solve several types of problems such as loans and investments Using the Finance Solver 1 Open the Finance Solver From the Finance menu select Finance Solver The solver displays its default values or previous values if you h...

Page 432: ...tions included In addition to the Finance Solver TI Nspire built in finance functions include TVM functions for calculating future value present value number of payments interest rate and payment amount Amortization information such as amortization tables balance sum of interest payments and sum of principal payments Net present value internal rate of return and modified rate of return Conversions...

Page 433: ... with the most recent expression at the bottom If the history does not fit in the Calculator work area you can scroll through the history Note You may notice a processing slowdown when the history contains a large number of entries Press or to scroll through the history À Current entry total entries Copying a Calculator history item to the entry line You can quickly copy an expression subexpressio...

Page 434: ...ft in combination with the arrow keys 3 Use the standard key shortcut for copying a selection Windows Press Ctrl C Macintosh Press C Handheld Press C 4 Place the cursor at the location where you want the copy 5 Paste the copy Windows Press Ctrl V Macintosh Press V Handheld Press V Note If you copy an expression that uses variables into a different problem the values of those variables are not copi...

Page 435: ...history When you clear the history all variables and functions defined in the history retain their current values If you clear the history by mistake use the undo feature To clear the history From the Actions menu select Clear History All expressions and results are removed from the history ...

Page 436: ...424 Calculator ...

Page 437: ... a variable Note Variables created with the Local command within a user defined function or program are not accessible outside that function or program Linking values on pages Values and functions created or defined in one application can interact with other applications within the same problem to share data When using linked items keep in mind Values can be linked between applications on one page...

Page 438: ...lete the following steps to create a variable named num and store the result of the expression 5 83 in that variable 1 On the Calculator entry line type the expression 5 8 3 2 Press to expand the cursor to the baseline Data type Examples Expression 2 54 1 25E6 2p xmin 10 2 3i xN2 2 List 2 4 6 8 1 1 2 red blue green Matrix This can be entered as 1 2 3 3 6 9 Character string Hello xmin 10 The answer...

Page 439: ...e Define command All of the following statements are equivalent 5 83 num num 5 83 Define num 5 83 Checking a variable s value You can check the value of an existing variable by entering its name on the Calculator entry line When you type the name of a stored variable it appears in bold type On the Calculator entry line type the variable name num and press The value most recently stored in num disp...

Page 440: ...tions including a table in the Lists Spreadsheet application Creating a variable from a Graphs Geometry value 1 Click to select the value to store as a variable 2 Click Handheld Press h The Variables options are displayed with Store Var highlighted 3 Press VAR appears before the selected value This is the default name ...

Page 441: ...er applications If necessary click Actions Show Hide Axes End Values to display the end values on the horizontal and vertical axes Click the number for an end value to highlight it in the entry field Name the variable and store it for use with other applications by using any method described in Step 2 Automatically creating variables in Lists Spreadsheet Naming a list at the top of a Lists Spreads...

Page 442: ... want to share 2 Click to open the Variables menu Handheld Press h 3 Select Store Var A formula is inserted into the cell with var as a placeholder for a variable name 4 Replace the letters var with a name for the variable and press The value is now available as a variable to other applications within the same problem Note If a variable with the name you specified already exists in the current pro...

Page 443: ...etters you typed Typing part of the name enables you to locate a variable more quickly if the list is long 4 When you locate and highlight the name of the variable you want to use click the name or press The selected variable value is linked Linking a Lists Spreadsheet cell to a variable When you link a cell to a variable Lists Spreadsheet keeps the cell value updated to reflect the current value ...

Page 444: ...n the entry line and press Calculator substitutes 517 the value currently assigned to num and evaluates the expression 2 Enter the expression Type 4 25 nonum 2 and press Enter Handheld Type 4 r 25 r nonum 2 on the entry line and press CAS Because the variable nonum has not been defined it is treated algebraically in the result Because the variable nonum has not been defined the expression returns ...

Page 445: ... move between the slider scale and the variable s value 3 Use and to move the slider on the scale 4 Press Enter to select the value Access the context menu and choose Settings to view or change the default slider settings Naming variables Variable and function names that you create must meet the following naming rules Note In the unlikely event that you create a variable with the same name as one ...

Page 446: ...as the last character of the name CAS If you want a variable to be treated as a type of unit such as _m or _ft use an underscore as the first character of the name You cannot use subsequent underscores in the name You cannot use an underscore as the first character of the name You cannot use a preassigned variable function or command name such as Ans min or tan Note For a complete list of TI Nspir...

Page 447: ...e variable menu list The Lock command clears the Redo Undo history when applied to unlocked variables Examples of locking For details about Lock UnLock and getLockInfo refer to the Reference Guide section of the documentation Time and altitude lists can be locked to ensure problem fidelity Reference function f1 can be locked to prevent unintended change Lock a b c Locks variables a b and c from th...

Page 448: ...id and Finance Solver variables such as tvm n tvm pmt and tvm fv As an example of using Ans calculate the area of a garden plot that is 1 7 meters by 4 2 meters Then use the area to calculate the yield per square meter if the plot produces a total of 147 tomatoes 1 Calculate the area On the Calculator entry line type 1 7 4 2 and press Enter Handheld On the Calculator entry line type 1 7 r 4 2 and ...

Page 449: ...and press Enter Handheld Type ans 2 r log 45 and press Temporarily substituting a value for a variable Use the such that operator to assign a value to a variable for just a single execution of the expression Removing a linked variable 1 Select the linked variable 2 Press h The Variables options display 3 Select Unlink The link is removed from the value and the value displays without any bolding ...

Page 450: ...438 Using Variables ...

Page 451: ... Collection tool Explore graphical and geometric transformations Explore and investigate concepts of calculus Link to data created by other applications and utilize it in Graphs Geometry À Graphs Geometry tool menu Á Sample Graphs Geometry work area in Graphing View  Sample tool icon Trace tool shows tooltip on hover à Sample Function graph from function expression on the entry line Ä Sample Grap...

Page 452: ...o display the menu on the Handheld press b Note In the 3D Graphing view the menu shows commands for working with 3D graphs specifically When you select a tool from the menu the tool s icon displays in the upper left corner of the Graphs Geometry work area You can hover over the tool icon to view tooltips Actions Pointer Selects moves and manipulates objects Select Lets you select the background im...

Page 453: ...ine or circle Calculate Opens the calculate tool to perform calculations using measurements numerical values or calculation results This tool is different from the Calculator application Redefine Redefines a previously defined point to a new location For example you can redefine a point in free space to a location on an object or redefine a point from one object to another Insert Slider Adds a sli...

Page 454: ...xes Hides the axes if they are currently displayed on the page Displays the axes if none are displayed on the page Show Hide Grid Turns the grid on or off for the work area or the analytic window Objects can be attached to the grid when the grid is displayed Hide Show Entry Line Hides or displays the entry line on the page Show Hide Scale Toggles between showing and hiding the scale legend on the ...

Page 455: ... p 24 for t step Polar Displays the Polar mode entry line at the bottom of the work area This display shows the q min q max and q step values The defaults are 0 2p for q min and q max and p 24 for q step Scatter Plot Displays the Scatter Plot mode entry line at the bottom of the work area Sequence Displays a Sequence mode entry line for a time plot or web plot or displays an entry line for a custo...

Page 456: ...uadrant The x and y scale factors are equal Zoom User If you have modified any window settings such as x min Zoom User saves the present settings If you have not modified any window settings since last selecting Zoom User Zoom User restores those settings Zoom Trig Automatically sets x min and x max to integer multiples of p The x and y scale factors are equal Zoom Data Redefines the axes so that ...

Page 457: ...les you to set the Graph Trace increment automatically or by specifying a numeric trace step value Geometry Trace Enables you to view the pathway of a geometric or analytic object such as a function graph on the work area Earlier portions of the pathway are automatically removed to reduce screen clutter Erase Geometry Trace Halts geometric trace and erases all persistent pathways on the work area ...

Page 458: ...n of two objects Point On Constructs a point defined on an object When the object is a function graph the coordinates are displayed Intersection Point s Constructs a point at each intersection of two selected objects Line Constructs a line defined by two points or by a point and a direction You can press g while creating a line to limit its orientation relative to an axis by 15 increments Segment ...

Page 459: ...ncrements Circle arc Creates an arc defined by three points Measurement Length Displays the distance between two selected points or the length of a segment perimeter circumference or radius Area Displays the area of a selected polygon or circle Slope Displays the slope of a selected line or segment A vertical slope is represented by Angle Displays the measure of an angle defined by three selected ...

Page 460: ...pressing You can press g while creating a polygon to limit its orientation relative to an axis by 15 increments Regular Polygon Constructs an n sided regular polygon Construction Perpendicular Constructs a line perpendicular to a selected line segment ray vector axis or side of a polygon and passing through a created or selected point Parallel Constructs a line parallel to a selected line segment ...

Page 461: ...alue to a selected object axis or function graph If the original value changes the change is also reflected in the transferred measurement Transformation Symmetry Creates the image of an object rotated 180 around a point Reflection Creates the image of an object reflected across a line segment ray vector axis or side of a polygon Translation Creates the image of an object translated by a specified...

Page 462: ...to functional areas of the application in the following order the entry line Entry Line Expansion button Slider Animation panel or Data Collection Console when present and then to the work area Edits if any are committed when you e out of a field Press g eto move through the tab stop areas in reverse order or press d to jump to a graph on the work area Moves up and down among menu options and thro...

Page 463: ... the line color or fill color of selected objects such as a function graph shape or point Note Color is supported for the TI Nspire software in Normal Desktop view If you are working in the Handheld view or using the TI Nspire handheld the colors display as shades of gray The Edit Relation option moves the focus to the entry line for editing the selected function The Convert to Analytic and Conver...

Page 464: ...ools You can hover over the tool icon to display tips to help you use the tool Grabbing and dragging items in the work area Dragging lets you move and manipulate items For example you can drag a text label to move it or drag a circle s perimeter to resize it 1 Point to the item The pointer changes to show that you can grab or manipulate the item 2 Use the mouse to grab and drag the item Handheld H...

Page 465: ...options to change text objects Convert text created in Graphing View to geometric text Convert text created in Plane Geometry View outside of the analytic window to analytic text Attach analytic or geometric text to text of the same type Use the Text tool to enter numerical values that the Graphs Geometry application can interpret as numbers You can use these numeric text entries for calculations ...

Page 466: ...nd object You can continue clicking objects to select all of the objects that interest you As each object is selected it flashes with the others in the selection You can deselect an individual object by clicking that object again or deselect the entire selection by pressing d or by clicking on a part of the work area that contains no object Selecting objects with the Select tool 1 From the Actions...

Page 467: ...t the location of your choice to complete the move Notes If an unmovable object is included in a selection then you must move the objects individually You cannot move the origin the axes or a pinned object as part of a multiple object selection Specific movements are supported for certain objects For example you can press an arrow key to move an object attached to the grid one point at a time Work...

Page 468: ...pearance of the selected object Attributes indicated with an asterisk support entering a number to indicate a value for the attribute Name Icon s Options Available for use on Line Weight Thin Medium Thick Line Tangent Segment Ray Vector Circle Circle arc Triangle Polygon Regular Polygon Rectangle Graphed Functions Integrals Line Style Continuous Dotted Dashed Line Tangent Segment Ray Vector Circle...

Page 469: ...vated Scatter Plot elements Graph Appearance Graph is continuous Graph is discrete Number of Points Step Size T Minimum T Maximum q Minimum q Maximum Graphed Functions Parametric and Polar graphs Axes Style Grid No Grid Axes Axes Settings Axes user settings Axes quadrant 1 settings Axes trig settings Axes stat settings Axes standard settings Axes decimal settings Axes Axes End Style No arrows Posi...

Page 470: ...ribute you want to change and use 7 or 8 to move through the options For example highlight the Line Weight option and use 7 or 8 to move to Thick Thin or Medium Axes Tic Labels Tic labels are shown Tic labels are hidden Axes End Values of Axes End values are shown End values are hidden Axes Line Equation Type Cartesian y _ Canonical _ 0 Line Tangent Segment Ray Vector Equation Type Canonical 0 Car...

Page 471: ...um values for supported graph types 5 Press to apply the option to the attribute Locking measured values and points Locking measured values and points can be useful when you need to prevent inadvertent change or for explorations in which object manipulations are constrained such that the locked measurement remains constant 1 From the Actions menu select Attributes 2 Select the value or point that ...

Page 472: ...ore geometric objects You can optionally use the Plane Geometry view in modeling mode that is Plane Geometry view with an analytic window added for working with objects in an axis system In 3D Graphing view the menu and work area change to let you graph and explore 3D functions of the form z x y The section Graphing 3D functions in this chapter discusses 3D features When you add a new document pro...

Page 473: ...e The Show Scale tool has no effect Uses Define graph and manipulate functions to Graph functions of the form f x Create scatter plots Graph polar equations Graph parametric equations Graph sequences Construct manipulate and measure analytic objects Display coordinates equations labels and informative text Construct manipulate transform and measure Euclidean objects Display labels and informative ...

Page 474: ...alytic window you cannot move an analytic object onto the plane geometry area Customizing the work area Panning views Panning lets you explore nearby objects parts of graphs or plots Grab any empty space in the work area and drag it The pointer changes to ù as you pan Note Panning works in both the Graphing View and the Plane Geometry View In Plane Geometry View with the Analytic Window shown you ...

Page 475: ... Actions menu select Attributes 2 Click either axis 3 Press 9 and to move to the desired attribute and then press 7 and 8 to choose the option to apply Zooming rescaling the work area Use one of the following methods to change the scale of the Graphing View or the Analytic Window in Plane Geometry View From the Window Zoom menu select one of the Zoom tools Zoom Box Zoom In or Zoom Out or select on...

Page 476: ...custom spacing of the tic marks and grid click the down arrow for XScale or YScale and type a value Note You can store an axis end value as a variable and then access it outside of the Graphs Geometry application Select the end value in the work area and then click or press h to store the value Inserting a background image You can insert an image as a background for a Graphs Geometry page The file...

Page 477: ...s location and visual appearance and its adjustment range and step size À Horizontal slider showing variable name current value and range Á Vertical slider  Slider thumb that you can drag to adjust the current value of the variable à Slider track Ä Minimized sliders with arrows to adjust the variable s current value Inserting a slider You can insert sliders on a Graphs page a Geometry page or a D...

Page 478: ...alog to enter settings for the slider Each setting is described below Settings that accept a numeric value also accept an expression that evaluates to a numeric value Variable Specifies which variable is assigned to the slider Type an available numeric variable name or click the drop down arrow and select a name from the list Value Sets the current value of the variable Minimum Sets the lowest val...

Page 479: ...as necessary to select the current value and type a numeric value Click a new position on the track Note Any time the variable s current value is outside the slider s defined range the thumb is not displayed To bring the value inside the slider s range click the slider track or arrows Repositioning a slider on the page Grab and drag any empty space in the slider s selection rectangle or click an e...

Page 480: ... 2 Press Tips for using sliders Use multiple sliders for a variable You can assign the same variable to multiple sliders This lets you see the effect of adjusting a variable by different step sizes or through different ranges Deselect a slider To deselect a slider click another part of the work area press d or press e e to move to another element in the work area Associate a different variable wit...

Page 481: ...e following ways Move to a point and hover to move the trace cursor to that point Press 7 or 8 to move the trace cursor from point to point and display the coordinates or values of each point Press 9 or to move from one graph to another The point s coordinates update to reflect the new location of the trace The trace cursor is positioned on the point of the new graph or plot with the closest x val...

Page 482: ...simultaneously With several functions graphed on the work area perform the following steps Note The Trace All tool traces only function graphs not plots of other relations polar parametric scatter sequence 1 Choose Trace All from the Trace menu A vertical line indicates the x value of the trace and a trace point appears on each function graphed on the work area 2 Press 7 or 8 to move the trace poi...

Page 483: ...ault q minimum and q maximum and q step displayed is optional To graph a scatter plot select Scatter Plot on the Graph Type menu The work area and entry line change to scatter plot mode Click var to choose variable to plot as x and y for sn You can also type the name of a variable that already exists or define a list as comma separated elements enclosed within brackets for example 1 2 3 Choose the...

Page 484: ...cify another press To graph the relation and activate the Entry Line Expansion button press e After you graph f1 x and redisplay the entry line the entry line displays f2 x to enable you to enter another function If you select or trace a function that function displays on the entry line As you graph multiple relations on the graph axes Graphs Geometry labels each unless the Graphs Geometry setting...

Page 485: ...tegral Note CAS You can also find the point of inflection 1 Select the point of interest on the Analyze Graph menu For example select Minimum to find the minimum point The icon for the selected tool displays at the top left on the work area Point to the icon to view a tooltip about using the selected tool 2 Click the graph you want to search for the point of interest When you point to the plot a d...

Page 486: ...on the entry line or manipulate a plot the point where the graph intersects the y axis can change You can exit the tool by pressing d or choosing another tool The labeled points of interest remain visible on the graph Specifying a function with domain restrictions You can use the entry line or the Calculator application to specify a function with domain restrictions For multiple domain restriction...

Page 487: ... or lists of variables in curly brackets Specify parameters to graph a family of up to 16 functions For example four functions are denoted with the expression f1 x 1 0 1 2 x 2 4 6 8 The first function to be evaluated is y 1 x 2 and the second is 0 x 4 2 Press to graph the family of functions specified Graphs Geometry creates and displays a separate graph object for each member of the family of fun...

Page 488: ... Type the expression that defines the sequence The term index n is a series of consecutive integers that starts with zero or any positive integer The sequence name can include letters numbers and parentheses in the formats u1 u1 n u1 myseq myseq n or myseq If you type the sequence name in the format u1 or myseq the application automatically adds the n The expression you type for a sequence can ref...

Page 489: ... sequence Click the sequence graph to see its expression and the label for the graph Animate a slider assigned to use a variable included in a sequence expression to observe changes in the plot Right click the work area and choose Graph Trace on the context menu to move through and highlight values for the sequence Handheld Press b and select Graph Trace to move through and highlight values on the...

Page 490: ...try application and assign each to an axis This section demonstrates how to create a custom plot using the Predator Prey model from biology to determine the numbers of rabbits and foxes that maintain population equilibrium rabbit n rabbit n 1 1 05 001 fox n 1 fox n fox n 1 1 0002 rabbit n 1 03 where 05 the growth rate of rabbits if there are no foxes 001 the rate at which foxes can kill rabbits 00...

Page 491: ...previously defined sequence or specify the name of a new sequence that you can define later 4 Press e to move to the next line and set the nstep and the range for n For this example n is set between 1 and 400 and the nstep is the default value 1 5 Press to create the custom plot Note Choose Zoom Fit on the Window Zoom menu to adjust the window settings 6 Explore the custom plot by grabbing and dra...

Page 492: ... logistic models and Lotka Volterra equations predator prey models You can also plot slope and direction fields with interactive implementations of Euler and Runge Kutta methods À Slope field Á A solution curve passing through the intitial condition  ODE editor Checkbox for designating this ODE as active or inactive y1 ODE identifier Expression k y1 defines the relation Fields 1 1 for specifying ...

Page 493: ...pression that defines the relation For example you might enter y1 0 1 y1 y2 3 Enter the initial condition for the independent value x0 and for y10 Notes The x0 value s are common to all the ODEs in a problem but can be entered or modified only in the first ODE They are displayed as non editable for the other ODEs You can delete an existing initial condition by clearing its x0 and y0 fields 4 If yo...

Page 494: ...ss the up or down arrow keys to move among ODEs that you have defined the graph is updated to reflect any changes One solution to the ODE is graphed for each IC specified for each active ODE selected by checkbox Summary of Differential Equation settings Solution Method Selects Euler or Runge Kutta as the numerical solution method Iterations Between Plot Step Computational accuracy for Euler soluti...

Page 495: ...ion to the ODE Direction Graphs a field in the phase plane representing the relationship between a solution and or values of a system of two 1st order ODEs as specified by the Custom Axes setting Exactly two ODEs must be active Axes user configured neither axis can be x Axes Default x and y Plots x on the x axis and y the solutions to the active differential equations on the y axis Custom lets you...

Page 496: ... the text box to the axis and drop it Graphs Geometry graphs the function Field Resolution Sets the number of columns of field rendering elements line segments used to draw a slope or direction field You can change this parameter only if Field Direction or Slope Direction Field at x Sets the independent variable value at which a direction field is drawn when plotting non autonomous equations those...

Page 497: ...e Catalog s Symbol Palette to choose from the inequality symbols and 4 Type the rest of the inequality expression and press to graph the expression The expression as typed displays when you hover at the boundary of the graph The shading on the graphs of inequalities shows the values that satisfy the inequality If you graph two inequalities that overlap the area of overlap is shaded darker than eit...

Page 498: ... Note To continue the custom naming convention you must manually rename each function as you enter it Editing functions You can edit graphed functions one function at a time To edit a function 1 Use one of the following methods to access the function Press d and double click the function label on the graph Click the Entry Line Expansion button or press to move to the function The expression displa...

Page 499: ...s 4 Press to graph the revised function Hiding a function on the work area 1 From the Actions menu select Hide Show The Hide Show tool icon displays at the top of the work area 2 Click the graph of any functions that you want to hide You can also click any other type of object that you want to hide Objects you click while the tool is active appear dimmed 3 Press d to exit the Hide Show tool The hi...

Page 500: ...st of graphed functions Manipulating functions Some functions allow you to translate stretch and or rotate them by grabbing and manipulating the graph From the Actions menu choose Pointer and then move to the graph that you want to manipulate The pointer changes to indicate supported manipulation for example to õ ö or é when you hover on a graphed function that you can grab and manipulate ...

Page 501: ... types of functions Linear function y b Linear function y ax b Quadratic function y a x b 2 c Quadratic function y ax2 bx c Exponential function y exp ax b c Exponential function y b exp ax c Exponential function y d exp ax b c Logarithmic function y a ln cx b d Sinusoidal function y a sin cx b d Cosinusoidal function y a cos cx b d ...

Page 502: ...r function Initial function graph Function translated along the x axis Notice the revised function label To translate grab near the middle of the graph and then drag Manually rotated function To rotate grab and drag near the ends of the graph ...

Page 503: ...nction Original quadratic function Manually rotated function To stretch grab away from the vertex of the graph and then drag Function translated on the x axis Function translated on the y axis To translate grab and drag near the vertex of the graph ...

Page 504: ...rement menu to measure it 1 From the Analyze Graph menu select dy dx 2 Click the point on the graph at which you want to find the derivative Original sine function Rotation manipulation of the sine function To stretch grab away from the axis of vertical symmetry of the graph and then drag Translation manipulation along the y axis Translation manipulation along the x axis To translate grab and drag...

Page 505: ...nction tables You can show a table of function values for any function in the current problem While viewing the table you can change the settings for the table delete columns add values for multiple functions and edit the expression that defines a function For details refer to Using Lists Spreadsheet Showing the table From the View menu select Show Table The table displays in a split screen showin...

Page 506: ...ew are retained and displayed along with any previously created graphs Creating an object in Plane Geometry View You can choose Geometry on an empty page of a document to work in Plane Geometry View The shapes points and lines you create while in this view are geometric objects Geometric objects can have an assigned scale such as centimeters instead of u for units as used with Graphing View When w...

Page 507: ...he next example the axes were altered Notice that only Circle A s appearance is affected by the change If you create an object with the axis hidden the object is a geometric object However if you create an analytic object and later hide the axis the object remains an analytical one Triangle as it appears in Graphing View The unlabeled vertex remains a geometric point ...

Page 508: ...ng view to work with analytic and geometric objects You can perform the following actions Use the View menu to show or hide the axes axes end values scale and grid Resale the axes using the Window Zoom tools or by dragging tic marks Grab an empty area of the screen and drag it to pan through the work area 4 Select Hide Analytic Window to remove the analytic window from the work area Working with C...

Page 509: ...metry Trace 3 Click the object or function and manually grab and move the object or select a point and use the Attributes tool to set animation If you use animation the point must be selected for Geometry Trace as well as animation See Changing an attribute of an object for details 4 Observe the Geometry Trace results In the following example a line segment was drawn and selected for Geometry Trac...

Page 510: ... see Selecting objects with the Pointer tool or Selecting objects with the Select tool 2 With selected objects flashing choose Group from the context menu Handheld Press b Macintosh Press and hold and click the group Windows Right click a selected object in the group The objects are grouped on the work area When you hover over or click an object in the group of objects the label group displays You...

Page 511: ...ion You can still edit a pinned object in some cases For example you can edit the x and y coordinates of a pinned point The point can move to reflect an edit of values but not in response to manipulation For an object that includes a Lock attribute locking is disabled after you pin the object When you point to a pinned object the pointer does not change to one that allows translation or grab and d...

Page 512: ...ns menu For example select the point using the Pointer tool and drag it to move it Notes A point that is pinned displays the pin icon and is not movable You can also create a point by typing an opening parenthesis and comma separated coordinates For example activate the Point tool type 3 5 and then press to create a point with abscissa 3 and ordinate 5 Creating a point on an object 1 From the Poin...

Page 513: ...int on the object Defining points of intersection Use this tool to find points at which two graphs intersect 1 From the Points Lines menu select the Intersection Point tool 2 Click each graph to find points of intersection The first intersection point between the two graphs is drawn If the graphs intersect in more than one place all intersection points are drawn ...

Page 514: ... Geometry View 1 Create a point You can also create a point on an object using the Point On tool 2 From the Actions menu select Coordinates and Equations 3 Move the pointer toward the point s location The coordinates display 4 Click to select the point The point blinks to indicate selection 5 Move to the place where you want to anchor the point coordinaties and press If you move the point to a dif...

Page 515: ...iately after you define the point For example when creating a triangle type the letter x after creating the first vertex Type y and z for the remaining two vertices as you create them Redefining a point You can redefine a point from a point on the work area to an object from one object to another or from the analytic window to the Plane Geometry View work area or from the geometric work area to th...

Page 516: ...ote If you press and hold g while creating the line you limit its orientation relative to the x axis or the horizontal aspect of the screen by 15 increments 3 Move and click again to define the direction and second point of the line Graphs Geometry draws the line Creating a ray 1 From the Points Lines menu select the Ray tool 2 Click to define the endpoint of the ray Note If you press and hold g w...

Page 517: ...k again to define the second endpoint of the segment Graphs Geometry draws the segment on the page Creating a segment with a defined midpoint With the Midpoint tool you can define a midpoint on an existing line segment between two specified points on a line or between two points as you create the points When you select the second point the midpoint is created 1 From the Construction menu select Mi...

Page 518: ...t the middle of the segment Creating a parallel line You can create a parallel line with respect to any existing line on the work area including the axes and the side of any triangle square rectangle and polygon 1 From the Construction menu select Parallel 2 On the work area click once on an existing line segment or axis This click identifies the reference line for the new parallel line you are cr...

Page 519: ... the work area including the axes and the side of any triangle square rectangle or polygon 1 From the Construction menu select the Perpendicular tool 2 Click a point on the work area through which the perpendicular line should pass A dotted line shows the position for the perpendicular line 3 Click again to anchor the perpendicular line The dotted line changes to a solid line Anchored parallel lin...

Page 520: ... drag the point and perpendicular line to the new location Creating a vector 1 From the Points Lines menu select the Vector tool 2 On the work area click the spot from which the vector originates 3 Move the pointer in the direction of the vector A dotted line follows the pointer as you move about the area 4 When the vector is in the correct position click to anchor the vector on the work area The ...

Page 521: ...int of the vector along that object Creating a tangent You can create a tangent by identifying a specific point on an existing object or function To create a tangent line 1 From the Points Lines menu select Tangent 2 On the work area select the point at which you want the tangent drawn A dotted tangent line blinks on the work area 3 Press to anchor the tangent on the work area Creating and working...

Page 522: ...e circle A dotted circumference displays Triangle 1 On the work area click once to establish the first vertex of the triangle 2 Move to the location for the second vertex and click the work area a second time The side of the triangle displays as a dotted line 3 Move to the location for the last vertex As you move all sides of the triangle are shown as dotted lines 4 Click the work area a third tim...

Page 523: ...on 2 Move the pointer away from the center point and click on the work area again to establish the first vertex and radius A 16 sided regular polygon is formed The number of sides displays near the center point in brackets for example 16 To reduce the number of sides select a vertex and move the pointer in a clockwise motion around the perimeter of the polygon To increase the number select a verte...

Page 524: ...ea again to establish the second point or complete the shape You will need to move and position the pointer as many times as required for the shape you are drawing You can move the pointer to the shape tool icon at the top of the work area to read tips for creating a shape 6 When all points or angles are in position press to complete the shape You can perform actions to explore the shapes you draw...

Page 525: ...er away from the defined point to obtain the equation of the object Measuring objects You can obtain various measurements from the objects you draw These measurements include finding areas lengths angles and slopes Measurement values are dynamic If you measure sides and angles of a triangle for example and then alter the triangle the measurement values update automatically To change the displayed ...

Page 526: ...ngth tool 2 Click or press to select the object The target segment circle arc or vector blinks 3 Click or press to anchor the measurement on the work area Note that a line segment can be part of a triangle rectangle or polygon Measuring distance between two points a point and a line or a point and a circle 1 From the Measurement menu select the Length tool 2 Select the first point 3 Select the sec...

Page 527: ...olygon 1 From the Measurement menu select the Length tool 2 Point to the side that you want to measure Initially the perimeter of the object displays along with a visual reminder that you can use e to measure the side instead 3 Press e to display the length of the side and click to attach it to the pointer 4 Position the measurement and click or press to anchor it on the work area In this example ...

Page 528: ...ck a point on one side of the angle to be measured 3 Click the vertex of the angle you want to measure When you move the pointer the measure of the angle displays near the second point clicked 4 Click on a point on the second side of the angle to be measured to anchor the value on the work area Defining an angle with three points You can define and measure an angle by selecting three points on the...

Page 529: ... and anchors the three points The measurement remains visible and close to the angle even if you change the size of the angle If you alter the angle the measurement updates to reflect the new value Notes The value of any angle will always be between 0 and 180 in degree mode or between 0 and p in radian mode The default angle measure is in radians for measurements within Graphing View or an Analyti...

Page 530: ...with that measurement are adjusted automatically to reflect the change The tool can use any measured value or numerical text entry as the value to transfer You can transfer the value to An axis This creates a point on the axis at a distance equal to the transferred value A new circle This creates a circle with a radius equal to the transferred value If you later delete the original value the circl...

Page 531: ...select Measurement Transfer 5 Click the number to transfer and then click the desired axis The value is marked by the addition of a point on the axis In this example the point has been labeled to show its coordinates Example Creating a circle using a transferred measurement 1 Create a triangle from the Shapes menu and then use the Measurements menu to measure the length of one side This length wil...

Page 532: ...le tool on the Shapes menu 2 Create a line segment using the Points menu and use the Measurements menu to create a measurement of its length This length will be used as the length of an arc on the circle 3 From the Construction menu select Measurement Transfer 4 Click the measured value that you created in step 2 5 Click the circle A point representing the start of the arc follows the pointer as y...

Page 533: ...n the points not the arc formed between the points The arc s length is the transferred measurement Using the Calculate tool The Calculate tool enables you to perform arithmetic calculations using measured and entered values An example best shows how this tool is used 1 Create an object and display measurements for it In this example a triangle is constructed and its angles are measured using the A...

Page 534: ...L when prompted for that term When all variables in the formula have values the answer displays on the work area 7 Press to anchor the result Transforming objects You can apply transformations to drawn objects and some can be applied to functions When working with functions the axes are most frequently involved and may be required Object transformations can occur without the use of axes as a refer...

Page 535: ...metry 1 Create an object 2 From the Points Lines menu select Point 3 Click the work area to create the point of symmetry 4 From the Transformation menu select Symmetry 5 Select the object then select the point The symmetrical image displays Exploring reflection 1 Create an object 2 Create a line or segment about which the object will be reflected 3 From the Transformation menu select Reflection 4 ...

Page 536: ...n of translation 3 From the Transformation menu select Translate 4 Indicate the distance and the direction of translation by performing one of the following actions Click the vector or Click the work area to indicate the distance between the object and the translation object then click a second time to indicate the direction of translation 5 Click the translation object The translated object displ...

Page 537: ... the point to rotate around and the angle of rotation a Type the opening parenthesis and type the x and y coordinates of the point to rotate the object around and press b Type the measurement to use for the angle of rotation and press The object is recreated in the rotated position as defined by the rotation point and angle of rotation Exploring Dilation 1 Create an object to enlarge by dilation 2...

Page 538: ... numbers after an opening parenthesis The Dilation appears on the work area Performing other investigations You can investigate other scenarios by bisecting segments lines and angles or by creating a Locus Bisecting a segment Bisecting an angle Finding the Locus Bisecting a segment 1 From the Construction menu select Perpendicular Bisector 2 Click the segment The perpendicular bisector displays No...

Page 539: ...g an angle 1 From the Construction menu select Angle Bisector Note If no angle is present on the work area you can create one by selecting three different points 2 Click to define the first side of the angle 3 Click to define the vertex of the angle 4 Click to define the second side of the angle Bisecting an existing segment bisector not anchored on page ...

Page 540: ...reating a locus The Locus tool enables you to explore the range of motion of one object with respect to another object as constrained by a shared point 1 Create a segment line or circle 2 Create a point on the segment line or circle 3 Create another object that uses the defined point created in the previous step Creating an angle bisector by defining three points The second point represents the ve...

Page 541: ...nt shared by the objects this is the object to constrain The continuous locus displays 7 Move the point on the first construction The second construction deforms to follow the locus point Circle created to use the defined point on the segment Two examples of the radius change of the circle as the locus moves along the line segment The radius is labeled to better show the change ...

Page 542: ...circle In addition you can also animate points on multiple objects in the work area at one time Animating a point on an object 1 From the Points Lines menu select Point On 2 Click the object to create the point on and then click the location for the point 3 From the Actions menu select Attributes The Attributes tool displays Locus created using a point and a segment ...

Page 543: ...ess and on the computer keyboard or handheld to increase decrease the speed of ongoing animation incrementally The animation control panel Once a point is animated a floating control panel displays on the page You can move this panel by dragging it to a new location When animation is active the panel contains a Reset and a Pause button When either button is pressed and animation is reset or paused...

Page 544: ...g the Reset button not only pauses animation but also returns the animated point to its initial coordinate position on the object when animation was first started If multiple points are animated on the page all are returned to their original locations when you select Reset Stopping animation To stop the animation of an object 1 Select the Pause or Reset button on the control bar 2 Display the Anim...

Page 545: ...his menu is specific to 3D Graphing and is accessible from the Graphs Geometry View menu Á Icon of the current 3D tool Rotation tool in this example Press d to close the tool and return to the Pointer tool  Sample 3D graph à Entry line with expression that defines the graph Ä Legend displaying orientation of the axes Defining a 3D graph Each 3D graphing page can show multiple graphs 1 From the Vi...

Page 546: ...ion 2 Modify the existing expression or type a new expression in the entry line 3 Press Setting the appearance of a 3D graph To set wire and surface color 1 Display the graph s context menu select Color and then select Line Color or Fill Color 2 Click a color swatch to apply it To set custom plot colors Custom plot colors can make it easier to see the shape characteristics of the graph You can ass...

Page 547: ...ph 1 Display the graph s context menu and then select Attributes You can set the following attributes for the selected graph format surface wire surface only or wire only x resolution enter a value in range 2 200 default 21 y resolution enter a value in range 2 200 default 21 transparency enter a value in range 0 100 default 30 shading controls highlights enter a value in range 0 100 default 50 Ha...

Page 548: ...o show or hide You can choose items such as the 3D box axes box end values and legend To set the visual attributes of the box and axes 1 Display the context menu for the box and then select Attributes You can set the following attributes show or hide tic labels show or hide end values show or hide arrows on axes show 3D or 2D arrow heads 2 Set the attributes as you like If necessary refer to Chang...

Page 549: ...ent to holding down the right arrow key 1 From the Actions menu select Auto Rotation The Auto Rotation icon appears and the graph rotates 2 Optional Use the up and down arrow keys to explore the rotating graph 3 To stop the rotation and return to the Pointer tool press d To view from specific orientations 1 If necessary press d to return to the Pointer tool 2 Use letter keys to select the orientat...

Page 550: ...ng and return to the Pointer tool press d To change the trace settings 1 From the Trace menu select Trace Setup 2 Enter or select the settings and click OK to apply them 3 If you are not already tracing your new settings take effect the next time you trace Animating a 3D graph with a slider 1 Insert a new problem and select the 3D Graphing view 2 From the Actions menu select Insert Slider click to...

Page 551: ...e entry line define the function shown here 5 Drag the slider thumb to see the effect of varying time 6 Add visual interest For example try Rotating the graph Hiding the box axes and legend Setting the graph s format attribute to show the surface only Changing the graph s transparency and shading attributes Changing the background color and graph fill color ...

Page 552: ...e slider s context menu and select Animate To stop select Stop Animate from the context menu You can combine manual or auto rotation with the slider animation Experiment with the x and y resolution to balance curve definition against animation smoothness ...

Page 553: ...r TI Nspire math and science learning technology applications Also share individual cells as variables Work with variables created in the Graphs Geometry and Calculator applications Collect tables of real world data from sensors Generate columns of data based sequences that you define Plot table data using the Data Statistics application Generate a table of values for a function Copy and paste tab...

Page 554: ... rows and columns à Lists Spreadsheet data plotted in the Data Statistics application Ä Entry line Lists Spreadsheet menu Actions Move Column Lets you reposition the current column Resize For a selected column lets you set the width to maximum minimum or a custom width For a selected row lets you set a custom row height Select Selects an entire row or column or helps you insert a range of cells in...

Page 555: ...nsert Insert Cell Inserts a cell Insert Row Inserts a row above the current row Insert Column Inserts a column before the current column Data Generate Sequence Displays a dialog box for creating a sequence Data Capture Allows manual or automatic capture of variable data from the Graphs Geometry Calculator or Data Statistics applications or within the Lists Spreadsheet application Press period Maci...

Page 556: ...application to graph one or two selected columns of data as a dot plot dot chart or scatter plot Statistics Stat Calculations Lets you select from several statistics calculations such as one variable analysis two variable analysis and regressions Distributions Lets you calculate and plot several distributions such as Normal Pdf Binomial Cdf and Inverse F Confidence Intervals Lets you calculate sev...

Page 557: ...w reference number Ä Entry line includes cell reference for current cell Å Cells Any empty void element in a list displays as an underscore _ Any value that cannot fit in a cell s width is truncated Hover over the cell to display the complete value Æ Naming zone first tab stop column names and formulas Ç Data zone second tab stop body cells Delete Column Removes the current column Choose Lets you ...

Page 558: ...row number such as G16 Press to put the selected cell in Edit mode Drag the scroll bar to move vertically without changing the cell or block of cells selected Creating and sharing spreadsheet data as lists You can define a column as a named list of elements of the same type of data After defining a list you can link to it from the Graphs Geometry Calculator or Data Statistics applications and from...

Page 559: ... list In a list named Heights for example refer to the first element as Heights 1 The expression Heights 2 refers to the second element and so on Linking to an existing list variable Linking a column to an existing list variable lets you easily view and edit the values in the list The list can be any shared list in the current problem and can be defined in Graphs Geometry Calculator or any instanc...

Page 560: ...n element from a list When you delete an element the remaining list elements shift upward to close the gap The upward shift affects only the selected column 1 Select the cell of the element to delete 2 Display the context menu for the cell and select Delete Cell Note If you press or Backspace to clear the contents of the cell instead of deleting the list element the element is assigned a value of ...

Page 561: ...y cells in a spreadsheet display as a void represented by an underscore _ The underscore is automatically added to empty cells when a list is named or when an empty cell is referenced in a formula When you plan to perform calculations on a range of cells be sure to notice the location of void cells Cells without a value can affect calculations For example if you include a void cell in the range fo...

Page 562: ...l that will contain the result 2 From the Actions menu choose Select Select Range A dotted selection rectangle appears around the cell that contains the formula 3 Select the range of values for which you want to calculate the mean Move to the first cell in the range then hold gwhile pressing the arrow keys The dotted selection rectangle moves to enclose the cells you specify for the range The form...

Page 563: ...lors carefully to ensure visibility as you work with documents in the software and on the handheld Changing the color of text 1 Select the cells that contain the text to change You can choose one or more cells in any adjacent cells columns or rows 2 Access the context menu and choose Color Text Color 3 Select the color to apply to the text Empty cells in the selection area will show the color chan...

Page 564: ...A4 Note You can select Recalculate from the Actions menu to update all references and formula results in a spreadsheet Deleting the contents of cells 1 Click a cell to select it or use the arrow keys to move to the cell Note If you are deleting a range of cells select a cell at one end or corner of the range and then use g with the arrow keys to select the remaining cells in the range 2 Press Note...

Page 565: ...t Note If you are repeating a range of cells drag to select the range or select a cell at one end of the range and then use g with the arrow keys to select the remaining cells 2 From the Data menu select Fill 3 Use the arrow keys or drag to select the range that will hold the repetitions 4 Press The value formula or pattern that you selected for duplication is repeated over the selected range Shar...

Page 566: ...ue of the variable Note Use caution if you link to a system variable Linking could prevent the variable from being updated by the system System variables include statistics results such as Stat RegEqn Stat dfError and Stat Resid and finance solver variables such as tvm n tvm pmt and tvm fv Working with rows and columns of data Selecting a row or column To select a row move to the top of the column...

Page 567: ...ng columns shift right to create space Note If other cells contain formulas with relative references to a displaced row or column those references adjust accordingly Deleting entire rows or columns You can delete a row column group of rows or group of columns When you delete a row or column the remaining rows or columns move up or left to fill the gap 1 Select the column or row that you want to de...

Page 568: ...Press or to place the insertion bar at the column s new position and then press Note Relative references to any cell in a position is affected by the move adjust accordingly Clearing column data The Clear Data command lets you remove the data from selected columns Clear Data does not delete the column and it does not clear a column s name or formula After clearing the data Lists Spreadsheet recalc...

Page 569: ...n numeric values If you select a key column that contains text you could get unexpected results 1 Select the range of cells 2 From the Actions menu select Sort The Sort dialog box displays 3 Select the column letter to use for ordering 4 Select Descending or Ascending as the sort method and then select OK Note Sorting a column that is defined by a formula will remove the fomula because it may not ...

Page 570: ...f you edit a cell manually in a column of generated data Lists Spreadsheet asks for confirmation before replacing the generated data Proceeding removes the generated data for the entire column Creating column values based on another column 1 Click the column formula cell the second cell from the top of the column where you want to use a formula Lists Spreadsheet inserts the leading equal sign for ...

Page 571: ...preadsheet inserts listname followed by the cursor 2 Type the expression for generating the random numbers You can use the Catalog to insert an expression instead of typing characters RandInt 1 6 20 This example places 20 random integers in the column 3 Press to generate the numbers 4 To generate Recalculate a new set of random numbers press R Macintosh R Generating a numerical sequence 1 Select a...

Page 572: ...rms field and separate them with commas 5 Type a starting value for the independent variable n0 6 Type a maximum number of values to be generated nMax 7 Type the step value nStep 8 Optional Type a maximum value for the sequence in the Ceiling Value field 9 Select OK Lists Spreadsheet shows the formula in the formula cell and fills the column with the results ...

Page 573: ...ta in one column or a scatter plot of two adjacent columns by using the Quick Graph feature This feature displays the graphed data using the Data Statistics application To create a scatter plot 1 Name both of the columns to declare them as lists 2 Select both columns 3 From the Data menu select Quick Graph A Data Statistics application is added to the page with the plotted data The leftmost of the...

Page 574: ...ring graphs Creating a summary plot from a summary table In this example you create a summary table from raw data and then use the table to generate a summary plot For an example of how to create a similar chart directly from the raw data refer to the Using Data Statistics chapter A summary table contains an X or Y List and a Summary List raw data summary table for eye color based on raw data ...

Page 575: ...ons in which you already have a summary table you can skip the first two steps 1 Create a list that holds the category identifiers For this example name the list color and enter strings for eye color Enclose category names in quotes to prevent them from being interpreted as variables 2 Create the summary list For this example name the list counts and enter the total count for each of the eye color...

Page 576: ...the axes and a summary plot symbol in the lower left corner of the chart window Note In this example the X List contains string data so the summary plot displays as a bar chart The category strings from the list display beneath the bars Exchanging data with other computer software You can use the TI Nspire desktop software to copy table data to and from software outside the TI Nspire applications ...

Page 577: ... the TI DataEditor 3 If necessary open the file containing the number list or matrix that you want to copy 4 Drag to select the values that you want to copy To copy an entire list click the top cell in the list 5 Click Edit Copy 6 In Lists Spreadsheet click the cell where you want the data to be pasted If you have copied a range of cells they will be pasted so that the upper left corner of the ran...

Page 578: ...ill be pasted so that the upper left corner of the range is positioned at the selected cell Any data in those cells in will be overwritten 4 Press V to paste the copied cells into Lists Spreadsheet Note Categorical data must be enclosed in quotes after the data is pasted Capturing data from Graphs Geometry You can use Lists Spreadsheet application to capture information about objects in the Graphs...

Page 579: ...e 2 Select the column formula cell the second cell from the top of the column in which you want to capture the values Note Captured values will replace values in the column 3 From the Data menu select Data Capture and then select Manual Data Capture A capture expression is inserted into the colum formula cell with var as a placeholder for the name of the variable you are capturing 4 Replace the le...

Page 580: ...ant the captures to be triggered by Changes in the captured variable only Changes in the captured variable or additional variables This lets you set up multiple columns of synchronized captures such as the x and y coordinates of a moving object To capture automatically 1 Clear all columns that you will be using for the captured data 2 Make sure any data values that you want to capture are linked t...

Page 581: ...rmula cell wil contain an expression similar to capture objpathX 1 objpathY 7 Press to complete the formula 8 If you are capturing multiple columns of synchronized data set up the additional columns For example you might set up a second capture variable using capture objpathY 1 objpathX 9 When you are ready to capture the values begin moving the object or start the animation that affects it in Gra...

Page 582: ...nt inputs used in Lists Spreadsheet wizards Input Description m0 Hypothesized value of the population mean that you are testing s The known population standard deviation must be a real number 0 List The name of the list containing the data you are testing Frequency List The name of the list containing the frequency values for the data in List Default 1 All elements must be integers 0 The frequency...

Page 583: ...ether variances are to be pooled for 2 Sample t Test and 2 Sample t Interval p0 The expected sample proportion for 1 Prop z Test Must be a real number such that 0 p0 1 x The count of successes in the sample for the 1 Prop z Test and 1 Prop z Interval Must be an integer 0 n The count of observations in the sample for the 1 Prop z Test and 1 Prop z Interval Must be an integer 0 x1 The count of succe...

Page 584: ...h the column letter of the list with a cell selected 3 Press e to move to the Y List box and click the drop down arrow to select a named list 4 To store the regression equation in a specified variable press e and replace Save RegEqn To with the name of the variable 5 Press e as necessary to move to the 1st Result box and type c as the column letter for the first result column 6 Select OK Lists Spr...

Page 585: ...n formula cell You could use the following formula to store the results in the variable group MystatsB LinRegMx a b 1 CopyVar Stat MystatsB Later you could view the results by entering the following expression in the Calculator application or in another column of the Lists Spreadsheet application MystatsB results Supported statistical calculations The Stat Calculations menu lets you select from th...

Page 586: ...ndent variable You can specify an optional frequency list The statistical data returned using this analysis technique are For each list sample mean or sum of the data or sum of the squared data or sample standard deviation sx sn 1x or sy sn 1y population standard deviation sx snx or sy sny X min or Y min first quartile Q1X or Q1Y median third quartile Q3X or Q3Y X max or Y max sum of squared devia...

Page 587: ... R2 For four points the equation is a polynomial fit for five or more it is a polynomial regression At least four points are required Quartic Regression QuartReg fits the fourth degree polynomial y ax4 bx3 cx2 dx e to the data It displays values for a b c d e and R2 For five points the equation is a polynomial fit for six or more it is a polynomial regression At least five points are required Powe...

Page 588: ...ributions and select Normal Pdf to choose the Distribution model The Normal Pdf dialog box opens and displays fields for typing or selecting the arguments for the calculation Press e as necessary to move from field to field and provide each argument You can type values or select them from the drop down list X Value Click the drop down arrow to choose any list in the problem to provide the x values...

Page 589: ...ter the function in a column formula cell In this case you specify a list column that contains the values For each value in the list the distribution returns a corresponding result Note For distribution functions that support the draw option normPDF t PDF c2 Pdf and F Pdf the option is available only if you enter the distribution function in a formula cell Normal Pdf normPdf computes the probabili...

Page 590: ... area under the normal distribution curve specified by mean m and standard deviation s This distribution is useful in determining the x value of data in the area from 0 to x 1 when the percentile is known t Pdf tPdf computes the probability density function pdf for the t distribution at a specified x value df degrees of freedom must be 0 The probability density function pdf is This distribution is...

Page 591: ... Cdf computes the c2 chi square distribution probability between lowBound and upBound for the specified df degrees of freedom You can click the Draw Shade area check box to shade the area between the lower and upper bounds Changes to the initial lowBound and upBound automatically update the distribution This distribution is useful in determining the probability of the occurrence of value within gi...

Page 592: ...ability of success in a success failure trial at trial n For example you could use this distribution to predict the probability of getting heads in a coin toss on the fifth toss Binomial Cdf binomCdf computes a cumulative probability for the discrete binomial distribution with n number of trials and probability p of success on each trial This distribution is useful in determining the probability o...

Page 593: ...in tosses that would be made before a heads resulted Geometric Cdf geomCdf computes a cumulative geometric probability from lowBound to upBound with the specified probability of success p This distribution is useful in determining the probability associated with the first success occurring during trials 1 through n For example you could use this calculation to determine the probability that heads ...

Page 594: ...mean college entrance test score of female students and the mean of college entrance test score of male students at the same school 2 Sample t Interval tInterval_2Samp computes a confidence interval for the difference between two population means m1Nm2 when both population standard deviations s1 and s2 are unknown The computed confidence interval depends on the user specified confidence level This...

Page 595: ...tains 0 this is insufficient evidence to indicate that the data exhibits a linear relationship Multiple Reg Intervals MultRegIntervals computes multiple regression prediction confidence interval for the calculated y and a confidence for y Stat Tests Supported Statistical tests Hypothesis tests are available from the Lists Spreadsheets application For complete information regarding these functions ...

Page 596: ...ntered in statistics than are large populations This test is useful in determining if two normally distributed populations have equal means or when you need to determine if a sample mean differs from a population mean significantly and the population standard deviation is unknown 2 Sample z Test zTest_2Samp tests the equality of the means of two populations m1 and m2 based on independent samples w...

Page 597: ...thesis H0 p1 p2 using the pooled sample proportion Ç against one of the alternatives below Ha p1ƒp2 Ha p1 p2 Ha p1 p2 This test is useful in determining if the probability of success seen in two samples is equal c2GOF c2GOF performs a test to confirm that sample data is from a population that conforms to a specified distribution For example c2 GOF can confirm that the sample data came from a norma...

Page 598: ... Ubnd lower and upper limits The F statistic is used as the bound producing the smallest integral The remaining bound is selected to achieve the preceding integral s equality relationship Sx1 Sx2 Sample standard deviations having and degrees of freedom df respectively F F statistic df x Fpdf with degrees of freedom df and p reported p value n1 1 n2 1 Sx1 Sx2 2 n1 1 n2 1 n1 1 n2 1 σ1 σ2 p f F α x n...

Page 599: ...ing if the variation of data from sample to sample shows a statistically significant influence of some factor other than the variation within the data sets themselves For example a box buyer for a shipping firm wants to evaluate three different box manufacturers He obtains sample boxes from all three suppliers ANOVA can help him determine if the differences between each sample group are significan...

Page 600: ...d Population variances are assumed to be equal To select the Pooled option select Yes from the drop down box Working with function tables The Lists Spreadsheet application lets you show a table of function values for any function in the current problem You can change the settings for the table delete columns add values for multiple functions and edit the expression that defines a function without ...

Page 601: ...ion choose Edit Expression You can also edit the expression directly on the entry line beneath the table Note When you edit the expression for a function that function automatically changes in the application used to define the function For example if you edit a Graphs Geometry function in the table the table values and graph of the function are both updated To change the default table settings ch...

Page 602: ...590 Using Lists Spreadsheet ...

Page 603: ...linked applications Explore central tendency and other statistical summary techniques Fit functions to data Create regression lines for scatter plots Graph hypothesis tests and results z and t tests based on summary statistics definitions or data À Data Statistics tool menu Á Work area  Add Variable regions on x axis and y axis à Normal Probability Plot with expression click line to display Ä Dat...

Page 604: ... Plot Displays data in a normal probability plot Data is grouped against the z value that corresponds to its quartile normal score This plot type is useful for checking for normality and determining the appropriateness of a normal model Scatter Plot Displays data in scatter plot form This is the default plot type for two numeric variables X Y Line Plot Displays data as an x y line plot Dot Chart D...

Page 605: ...for setting the histogram values for bin width and alignment Extend Box Plot Whiskers Show Box Plot Outliers Extend Box Plot Whiskers extends the whiskers to the min and max of the data Show Box Plot Outliers stops the whiskers at 1 5 Interquartile Range and shows outliers as individual dots Note If there are no points outside of 1 5 Interquartile Range there may appear to be no whisker change Sho...

Page 606: ...Categorical X Treats the variable on the x axis as a categorical variable list of strings The numeric axis is replaced by labels for categorical data Force Numeric Y Treats the variable on the y axis as a numeric variable although the default is categorical list of strings The categorical data label is replaced by an axis with numbers Note Forcing a numeric variable is supported only when there ar...

Page 607: ...bject for dynamically changing the value of a numeric variable Select all Points Selects all points in the work area Select Image Selects the background image Sort Sorts the data in List Value or Alpha order Analyze Remove Removes a selected Movable Line Regression Plotted Value or Plotted Function Add Movable Line Adds a line you can position and reposition in the work area This can be used for m...

Page 608: ...Logistic d 0 Logistic dƒ0 Residuals The residuals tools display information about the residuals of the selected model These tools are available when a scatter plot and one or more lines regressions or plotted functions are on the work area Show Hide Residual Squares displays the squares of residuals Show Hide Residual Plot plots the residuals against the explanatory variable The residual is the di...

Page 609: ...on of the data in the histogram Note This tool is available when a histogram is present Graph Trace Lets you trace the graph from Plot Function Show Normal PDF Add Movable Line distribution curves regressions case plots dot plots scatter plots X Y line plots box plots histograms bar charts pie charts or multiple plots Window Zoom Window Settings Displays a Window Settings dialog that enables you t...

Page 610: ...hoose None to remove the default case plot Choose the name of a variable to have it replace the current case plot variable Hover over any data point to see the summary information Drag any data point toward an axis to see how the points group Activate the Graph Trace tool and press 7 or 8 to move across points When you add a variable to either axis the plot for that variable replaces the default c...

Page 611: ...ate for various plots also display on the context menu Selecting data and displaying summary information When you hover over part of a plot the Data Statistics application displays summary information for the data it represents 1 Hover at an area of interest in a plot to display data values or summary information For example you can hover over the center of a box plot to display the median summary...

Page 612: ...ariables as a scatter plot 5 Optional Repeat Steps 1 3 to choose additional variables to plot on the vertical axis The name of each variable that you add is appended to the label on the axis The default data point shape changes to help you distinguish data and a legend displays to identify the shapes 6 Change analyze or explore the plotted data Remove or change the variable on an axis by clicking ...

Page 613: ... because of the formula s restrictions For example you can manipulate a plot that represents the result of y x but you can only move along a line You cannot move points that represent data in a locked variable or data that represents a categorical value To move plotted data 1 On the Data Statistics work area click a representation of data such as a histogram bin or a whisker of a box plot that is ...

Page 614: ...a variety of ways Choosing the appropriate plot can help you visualize the data For example you may be able to observe the shape and spread of the data in one plot type and another type may be useful for determining the best method for statistically evaluating data Use Data Statistics to create the following types of numeric plots Dot Plot Box Plot Histogram Normal Probability Scatter Plot X Y Lin...

Page 615: ...he list for the variable Activate the Graph Trace tool and press 7 or 8 to move across the data points in the plot in list order Points enlarge and display a bold outline as you move across them in Trace mode Creating box plots The Box Plot Tool plots one variable data in a modified box plot Whiskers extend from each end of the box either to 1 5 times the interquartile range or to the end of the d...

Page 616: ... from the Plot Types menu 2 On the Plot Types menu select Box Plot A modified box plot displays on the Data Statistics work area Note You can split a box plot by category by adding a list that contains corresponding categorical data to the y axis 3 Optional To add additional variables for comparing box plots on the same axis click Add X Variable on the Plot Properties menu ...

Page 617: ... over a region or over a whisker to display the details for the portion of the plot that interests you The label for the quartile that corresponds to your selection displays Click a region of the box plot to select the data points or whiskers Click again to remove the selection You can select any box plot that does not include frequency data and choose Dot Plot on the context menu to change the pl...

Page 618: ...ot split by category Adding the categorical list splits the box plot by category A split box plot is useful for comparing the spread of various populations Plotting histograms A histogram plots one variable data and depicts the distribution of data The number of bins displayed depends on the number of data points and the distribution of these points A value that occurs on the edge of a bin is coun...

Page 619: ...ble in categorical plots Activate the Graph Trace tool and press 7 or 8 tto move across the bins and display values Creating a histogram with frequency or summary data 1 On a Lists Spreadsheet page create two lists one containing the bins such as heights in a population ht and the other containing the frequencies of those heights freq 2 On a Data Statistics page access the context menu on the x ax...

Page 620: ... and choose Bin Settings The Bin Settings dialog displays 2 Type values to set width and alignment of the bins that represent histogram data To specify bin width type a value in Width To specify bin placement type a value in Alignment Note You can also modify the bins by clicking and grabbing the edge of any bin and dragging it to the desired size 3 Click OK to apply the changes The bins of the hi...

Page 621: ...l probability plot Use a named list from Lists Spreadsheet or Calculator 2 Plot the data in one of the following ways Create a dot plot by selecting a column and choosing Quick Graph Add a Data Statistics work area Click the Add Variable region on an axis and select the data list name to plot the variable 3 On the Plot Types menu select Normal Probability Plot The data graphs in the Data Statistic...

Page 622: ...the data using the available tools on the Analyze menu For example choose the Graph Trace tool and press or to move across the plot 4 Optional To plot additional lists against the x axis right click the y axis and select Add Variable Creating an X Y line plot An X Y line plot is a scatter plot in which the data points are plotted and connected in order of appearance in the two variables Like scatt...

Page 623: ...ypes Dot Chart Bar Chart Pie Chart The categorical plot types can be used to compare the representations of data across different plots When the same variable list is used for a dot chart and a bar chart or pie chart in a problem selecting a data point or segment in one of the plots selects the corresponding data point segment or bar in all other plots that include the variable Creating a dot char...

Page 624: ...tatistics page and plot the selected column The new Data Statistic work area displays a default case plot with a caption variable name and unplotted data points for the variable You can click the variable name in the caption to choose another variable for previewing or drag a default data point toward an axis to plot the current variable 3 Move near the center of either axis and click the Add List...

Page 625: ...eselect it or remove it from a selection of multiple dots Activate the Graph Trace tool and press 7 or 8 tto move across the points in list order Dots display a bold outline as you move across them in Trace mode Creating a bar chart Like dot charts bar charts display categorical data The length of a bar represents the number of cases in the category 1 Click the Add Variable region of either axis a...

Page 626: ...requency table or summary data 1 On a new Data Statistics page create a bar chart with frequency or summary data by choosing Add X Variable on the Plot Properties menu Note You can also create a bar chart with frequency by choosing Add Variable with Summary List from the context menu of the Add Variable region of an axis 2 Select the desired variable from the pop up 3 Set the height of the bars wi...

Page 627: ... the Graph Trace tool on the Analyze menu to move across all of the bars displaying the summaries 6 Optional Add summary lists to create a comparative bar chart Creating a pie chart A pie chart represents categorical data in a circular layout and uses an appropriately proportioned segment for each category 1 Create a dot chart on the work area 2 On the Plot Types menu select Pie Chart The dots mov...

Page 628: ... the summaries The summary shows the number of cases for the category and the percentage among all cases Note You can switch to a pie chart from a bar chart generated from summary data Creating a comparative bar chart This might be used to explore data in a 2 way table 1 Enter the raw data on a Lists Spreadsheet page 2 From the Insert menu in the toolbar select Data Statistics ...

Page 629: ...color data is plotted 5 To split the eyecolor data by gender select the Plot Properties menu select Split Categories by Variable and then select gender Splitting a numeric plot by categories You can use a categorical split to sort the values plotted on an axis 1 Open a problem that includes a Lists Spreadsheet page or create data to be plotted in the Lists Spreadsheet application In this example l...

Page 630: ...ck Graph tool The Quick Graph tool adds a Data Statistics page Data Statistics plots the variable and labels the horizontal axis 4 To plot the numeric data for each category hover on the Add Variable region near the center of the vertical axis and click the tooltip Click or Enter to add variable The list of available variables displays ...

Page 631: ...tatistics labels the vertical axis and plots the numeric data for each category Exploring data You can manipulate and explore plotted data Select and move points or data bins Change the type of plot Rescale the graph Add a movable line Show regression lines Show residual squares Show a residual plot ...

Page 632: ...preadsheet the data that corresponds to the original point or bar automatically updates in the original column s in Lists Spreadsheet as you move the point You can also move points or bins by changing the numbers in the Lists Spreadsheet or Calculator applications Data will update in all of the representations Moving multiple points 1 Position the pointer over each data point that you want to sele...

Page 633: ...egories You can sort plotted categories in list order value order or alphabetically by category name 1 Click the work area that contains the plotted data 2 On the Actions menu select Sort and select the type of sort Note You can customize the order of the categories by clicking a label and dragging it Plotting a value You can plot a value on an existing plot It displays as a vertical line in the w...

Page 634: ...he frequency list in your expression For example type the expression v1 mean cost frequency in the plot value entry box 3 Click the line to display the value Note Double click the value to edit the expression You can use Plot value for a single number or any expression that evaluates to a number If the value is dependent on the data like mean when you drag a point or make changes in the Lists Spre...

Page 635: ...if the plotted data cannot be represented by the plot type For example if a scatter plot is displayed in the work area you cannot create a box plot without first removing the variable from the y axis Rescaling a graph You can change the scale of the axes by using translation and Dilation The cursor changes to indicate whether translation ö or Dilation ô is available in zones on the axes Translatio...

Page 636: ...he cursor over a tic mark or label near the ends of the axis The cursor changes to ó on the vertical axis or ô on the horizontal axis 2 Click to grab The cursor changes to Drag the cursor to the desired position and release Adding a movable line You can add a movable line to a plot Moving and rotating the line on the work area changes the function that describes it From the Analyze menu select Add...

Page 637: ...ble line in the variable m1 Rotating a movable line 1 Click and grab on either end of the line The cursor changes to é 2 Drag to rotate and change the slope of the line The function m1 x is updated for the changes in the position of the movable line Changing the intercept 1 Click in the middle of the movable line The cursor changes to ö 2 Drag to change the intercept ...

Page 638: ...alyze menu Tracing a movable line You can trace a movable line to predict and analyze values 1 Click the line The cursor changes 2 From the Analyze menu select Graph Trace to enable Trace mode for the line Rotation of the line is not supported in Trace mode 3 Press or left or right arrow keys to trace the movable line If the plotted variables change points on the graph and the line are updated aut...

Page 639: ... line as shown in the following example When the line of regression is selected the expression for the line displays Showing residual squares You can display residual squares on a plot Residual squares can help you assess the appropriateness of the model for your data Note This tool is only available when a regression or movable line is present in the work area From the Analyze menu select Residua...

Page 640: ... the residual The residual plot for the selected regression or function displays in the work area For consistency in comparing sets of data residual plots do not rescale when you move from one function or regression to another Select a function or regression before a showing residual plot If no function or regression is selected and there are several plotted Data Statistics arbitrarily selects the...

Page 641: ...he new values over the old values 4 Select OK to apply the changes and redraw the plot Using the Zoom Data tool On the Window Zoom menu select Zoom Data The work area rescales to display all plotted data Using the Zoom In tool 1 On the Window Zoom menu select Zoom In 2 In the work area click the center point of the area of interest This will be the center of the zoom in action The plot redraws to ...

Page 642: ...ur work area contains both a horizontal axis and a vertical axis scale 2 From the Analyze menu select Plot Function A function entry field displays in the work area Note You can edit the function s expression typed in the entry field However the function graphed in Data Statistics cannot be manipulated or moved around the work area To do that use Graphs Geometry 3 Type the function in the entry fi...

Page 643: ...n access any variables defined in a Lists Spreadsheet or Calculator application in your problem from the variable list 2 From the Analyze menu select Plot Function A function entry field displays in the work area 3 Click h A list of variables available in the problem displays 4 Click to select the variable containing the function you want to plot In the example below the variable a contains the fu...

Page 644: ... the same manner as any other variable Support for all function types is included Note Function numbers increment to use the next available If you have defined f1 x and f2 x in Graphs Geometry the first function you create in Data Statistics will be f3 x Using Show Normal PDF You can approximate data plotted in the Data Statistics work area against the normal probability density function The tool ...

Page 645: ...nu to remove the PDF Using Shade Under Function Use Shade Under Function to find the area of a selected region under a function graphed in the work area 1 Select any function graphed in the Data Statistics work area For example select a previously graphed normal PDF 2 From the Analyze menu select Shade Under Function The cursor becomes a dotted vertical line and the boundary ˆ displays when you po...

Page 646: ...ick or click the shaded region and choose Remove Shaded Region To change the fill color of the shaded area right click or click the shaded region choose Color choose Fill and click a color Use plot value to set the boundary to an exact number When a boundary for shading is set to a plotted value you can change the plotted value to update the shading Edit a shaded region by clicking and dragging th...

Page 647: ...e data To emphasize or distinguish certain parts of your work you can change the default color for a variable s data Apply fill colors to objects such as shading or change the color for a variable s data points Apply color to plotted lines such as lines of regression or movable lines TI Nspire handhelds without color show color objects in shades of gray The color information is preserved in the do...

Page 648: ...ur needs Move the cursor over the edges of the text box to drag the borders and change the width or height Click and grab the text box to move it near objects that relate to the text Scroll to view additional text in a box by clicking the arrows at the top and bottom edge Click outside of the text entry box to exit the Text tool Hide text by selecting the Actions menu and choosing Hide Text Change...

Page 649: ... variable s current value Inserting a slider You can insert sliders on a Graphs page a Geometry page or a Data Statistics page 1 From the Actions menu select Insert Slider A gray image of a horizontal slider with default settings attaches itself to the pointer 2 Drag to position the slider and click to release it 3 Press to accept the default name such as V1 or type the name of a numeric variable ...

Page 650: ...ble name or click the drop down arrow and select a name from the list Value Sets the current value of the variable Minimum Sets the lowest value in the slider range left or bottom end point on the track Maximum Sets the highest value in the slider range right or top end point on the track Step Size Sets the size of the increment between values The default setting is Automatic To enter a specific s...

Page 651: ...side the slider s range click the slider track or arrows Repositioning a slider on the page Grab and drag any empty space in the slider s selection rectangle or click an empty space in the slider and then press 9 7 or 8 Mimimizing a slider To minimize a slider and display only the variable name current value and direction arrows access the slider s context menu and select Minimize To further minim...

Page 652: ...ble by different step sizes or through different ranges Deselect a slider To deselect a slider click another part of the work area press d or press e e to move to another element in the work area Associate a different variable with a slider Click the text box for the variable name and type the name of the numeric variable to use With the slider active click the h button to select a variable from t...

Page 653: ...lect Distributions and select Normal Cdf 3 Enter the plot parameters into the Normal Cdf wizard 4 Click the Draw check box to see the distribution plotted and shaded in Data Statistics Note The Draw option is not available for all distributions 5 Select OK ...

Page 654: ...rawing the plot in the previous example you can explore the effect of changing the upper bound On the Data Statistics plot drag the vertical line that represents the upper bound toward the left or right As you drag the formula is updated and the shaded area is recalculated ...

Page 655: ...orm calculations using math expression boxes Getting started with the Notes application To add a blank Notes page to an existing or new document In a new document select Add Notes from the menu In an existing document select Notes from the Insert menu From a handheld click to open a new document with a notes page or add a notes page to an open document The Notes work area is displayed in Default m...

Page 656: ...ts or images Format the text in a note Customize a math expression Perform calculations Opening Notes On your desktop the Notes menu icons are displayed in Documents Toolbox panel With the Notes application active click to open the Notes menu On a handheld press b to open the Notes menu ...

Page 657: ...templates Use the options on the Templates menu to select a format for your Notes page Menu Name Menu Option Function 2 Templates 1 Q A Creates a template to enter question and answer text 2 Proof Creates a template to enter statement and reason text 3 Default Lets you enter freeform text 4 Hide Answer Q A Toggles to show or hide the Answer in a Q A format À Á ...

Page 658: ...e Q A template Use the Q A template to create questions and answers You can show or hide the answer so you can create questions for review and hide the answers When you use the document as a study aid you can verify that your answers are correct Press e to move the text cursor between the Question and Answer areas of the template Using the proof template The proof template provides an outline stru...

Page 659: ...moves all other formatting 3 Italic Toggles the selected text between italic and not italic and removes all other formatting 4 Underline Toggles the selected text between underlined and not underlined and removes all other formatting 5 Subscript Toggles the selected text between subscripted and not subscripted and removes all other formatting 6 Superscript Toggles the selected text between supersc...

Page 660: ... the following On the Format menu select the name of the format to apply Handheld Press b to display the Notes menu On the Format menu select the name of the format to apply Note You can restore the text to normal by reapplying the same format Using color in Notes When working in the Notes application on a desktop use the fill color or the text color options on the Documents workspace tool bar to ...

Page 661: ...ace tool bar click From a handheld press then select Edit Fill Color 3 When the Fill Color palette is displayed click a color to apply it to the selected area Inserting Images When working in the Notes application on a desktop use the Images option on the Insert menu to add an image to a Notes page Note The option for inserting an image is not available when working on a handheld However you can t...

Page 662: ...shapes or comments When working with the Notes application on a handheld open the Insert menu to insert a math expression shape or a comment Inserting comments You can insert Teacher or Reviewer comments into a Notes application Comments are easy to distinguish from the original text 1 Define the type of comments you re inserting Teacher or Reviewer On the Insert menu select Comment and then selec...

Page 663: ... geometric shape symbols You can use geometric shape symbols to designate selected text as geometric objects such as an angle circle or line segment To insert a shape symbol position the cursor where you want it then do the following On the Insert menu select Shapes and then select the shape to apply Handheld Press b to display the Notes menu On the Insert menu select Shapes and then select the sh...

Page 664: ... Menu Name Menu Option Function 5 Math Box Options 1 Math Box Attributes When a math box is selected this option opens a dialog box allowing you to customize the math box You can hide or show input or output turn off calculation for the box insert symbols change display and angle settings and allow or disallow the wrapping of expressions and the display of warning indicator after they have been di...

Page 665: ...o evaluate or approximate an expression place the cursor anywhere in the math expression box and then do the following Windows On the Actions menu select Evaluate or Approximate You can also use Enter to evaluate or Ctrl Enter to approximate Macintosh Press Enter to approximate Menu Name Menu Option Function 1 Actions 1 Evaluate Evaluates the expression 2 Approximate Approximates the expression 3 ...

Page 666: ...nd you can end the calculation To stop the function or program in progress do the following Windows Hold down the F12 key and press Enter repeatedly Macintosh Hold down the F5 key and press Enter repeatedly Handheld Hold down the c key and press repeatedly Showing warnings and errors If a calculation in Notes results in a warning or error you can view the warning or error again even after you have...

Page 667: ...vating a box or a group of boxes To deactivate a box or a group of boxes do the following 1 Select the box or boxes that you want to deactivate 2 Deactivate the selected box or boxes Windows Select Actions Deactivate or right click and select Actions Deactivate Macintosh Select Actions Deactivate or ì click and select Actions Deactivate Handheld Press b to display the Notes menu On the Actions men...

Page 668: ... both radian degree and gradian angle measures in the same Notes application Select whether to allow math expressions to wrap Select whether to show or hide warning indicators To change the attributes of one or more boxes do the following 1 Select the box or boxes that you want to change 2 On the Math Box Options menu select Math Box Attributes 3 Use the drop down menus or selection boxes to make ...

Page 669: ...Calculator instead Notes does not support the execution of multiple statistics commands that produce stat variables Menu Name Menu Option Function 6 Calculations 1 Define Variables Define a variable in a Note using the Calculator application 2 Number Use tools from the Calculator Number menu including Convert to Decimal Approximate to Fraction Factor Least Common Multiple Greatest Common Divisor R...

Page 670: ...sions Trigonometry Complex and Extract 4 CAS Calculus Use tools from the Calculus menu including Derivative Derivative at a Point Integral Limit Sum Product Function Minimum Function Maximum Tangent Line Normal Line Arc Length Series Differential Equation Solver Implicit Differentiation and Numerical Calculations 5 Probability Use tools from the Calculator Probability menu including Factorial Perm...

Page 671: ...ou how the Notes application works with other applications to automatically update results 7 Matrix Vector Use tools from the Calculator Matrix Vector menu including Create Transpose Determinant Row Echelon Form Reduced Row Echelon Form Simultaneous and others 8 Finance Use tools from the Calculator Finance menu including Finance Solver TVM Functions Amortization Cash Flows Interest Conversions an...

Page 672: ... math box evaluate and hide the output using the Math Box attributes 3 Type some more text for example Real Roots of f1 x are 4 In a new math box type polyRoots f1 x x 5 Press and hide the input of this math box by using the Math Box attributes dialog box 6 Use the Page Layout toolbar icon to select the split layout 7 Add the Graph application and plot f1 x ...

Page 673: ...ype Create sample data b Insert a math expression box and define the population For example type population seq n n 1 50 c Press and hide the output using the Math Expression Box Attributes dialog box d Insert a math expression box and define the sample size For example type size 5 e Press and hide the output using the Math Expression Box Attributes dialog box 2 Set up the initialization a Type St...

Page 674: ...g XMins 1 and XMax 50 d You can also set up the plot of the mean of sample means using Analyze Plot Value 4 Enter the instructions to add data a Type Create new samples b Insert a math expression to define the sample sample and update the number of samples and the list of sample means Type num num 1 sample randsamp population size sampmeans augment sampmeans mean sample c Press hide the output and...

Page 675: ...experiments num sample sample and the list of sample means sampmeans 5 Now you are ready to explore Add more samples by simply pressing when you are in the math expression box in the Create new samples section Note You can also automate the sampling process by using a For EndFor loop ...

Page 676: ...664 Using Notes You can also change the sample size and restart the sampling ...

Page 677: ...eate public library objects that appear in the TI Nspire Catalog For example suppose you have created library document matrix containing public library function diagwithtrace and a private library function errmsg Function diagwithtrace displays the diagonal of a square matrix and calculates the trace of the matrix If its input is not a square matrix the function calls errmsg which should then retu...

Page 678: ...or program you must store the object and also save the document Saving the document does not automatically store the object For more information see the Programming section of the documentation Naming restrictions apply to library documents and library objects A library document name must be a valid variable name between 1 and 16 characters long and it must not contain a period or begin with an un...

Page 679: ...all defined objects including private public and non library objects You can access a library object from any document by typing the object s long name A long name consists of the name of the object s library document followed by a backslash followed by the name of the object For example the long name of the object defined as func1 in the library document lib1 is lib1 func1 To type the character o...

Page 680: ...sing a private library object 1 Refresh the libraries 2 Open the TI Nspire application in which you want to use the variable function or program Note All applications can evaluate functions but only the Calculator and Notes applications can run programs 3 Type the name of the object such as lib1 func1 In case of a function or program always follow the name with parentheses To type the character on...

Page 681: ... Algebra functions The library is named linalg or linalgCAS and is installed in the designated library folder Note Updating the handheld s operating system or reinstalling the computer software places all included libraries in the default folder If you have edited an object in an included library or replaced an included library with your own document of the same name updating or reinstalling will ...

Page 682: ...location of the designated library folder from the default MyLib folder to any folder on your local drive or network 1 On the File menu select Settings Keypad Options For TI Nspire Teacher Software click File Settings SmartView Options 2 In the Options dialog box click Browse and then navigate to the folder that you want to designate 3 Select the folder and then click OK 4 In the Options dialog bo...

Page 683: ...Libraries 671 The location of the designated folder is determined during software installation By default this folder is Windows My Documents TI Nspire MyLib Macintosh Documents TI Nspire MyLib ...

Page 684: ...672 Libraries ...

Page 685: ...rograms The editor has programming templates and dialog boxes to help you define functions and programs using correct syntax The editor lets you enter multiple line programming statements without requiring a special key sequence to add each line You can easily create private and public library objects variables functions and programs For details see the Libraries chapter The editor is accessible f...

Page 686: ...iew Lets you view and optionally edit an existing library function or program Create Copy Lets you copy the current function or program Rename Lets you rename the current function or program Change Library Access Lets you change the access level of a library object to private LibPriv public LibPub or none Insert Comment Inserts a comment at the cursor position Find Displays a dialog box for text s...

Page 687: ...rts DelVar Func EndFunc Inserts Func EndFunc template Prgm EndPrgm Inserts Prgm EndPrgm template Lock Inserts Lock unLock or getLockInfo Control If Inserts If statement If Then EndIf Inserts If Then EndIf template If Then Else EndIf Inserts If Then Else EndIf template ElseIf Then Inserts ElseIf Then template For EndFor Inserts For EndFor template While EndWhile Inserts While EndWhile template Loop...

Page 688: ...e Disp display command Inserts the command Inserts the command Inserts the command Mode Display Digits Lets you select from several Float and Fix settings Angle Lets you select Degrees Radians or Gradians Exponential Format Lets you select Normal Scientific or Engineering Real or Complex Lets you select Real Rectangular or Polar Auto or Approx CAS Lets you select Auto Approximate or Exact results ...

Page 689: ... 3 Type a name for the function or program you are defining 4 Select the Type Program or Function 5 Set the Library Access To use the function or program only from the current document and problem select None To make the function or program accessible from any document but not visible in the Catalog select LibPriv Vector Format Lets you select Rectangular Cylindrical or Spherical Base Lets you sel...

Page 690: ...ressions as you enter them They are executed only when you evaluate the function or run the program 1 If your function or program will require the user to supply arguments type parameter names in the parentheses that follow the name Separate parameters with a comma 2 Between the Func and EndFunc or Prgm and EndPrgm lines enter the lines of statements that make up your function or program You can e...

Page 691: ...rst line in a Func or Prgm block the comment displays in the Catalog as help For details see the Libraries chapter To insert a comment 1 Position the cursor at the end of the line where you want to insert a comment 2 From the Actions menu select Insert Comment 3 Type the text of the comment after the symbol Checking syntax The Program Editor lets you check the function or program for correct synta...

Page 692: ...essage and tries to position the cursor near the first error If no syntax errors are found the message Stored successfully is displayed in the status line at the top of the Program Editor Note If the function or program is defined as a library object you must also save the document in the designated library folder and refresh libraries to make the object accessible to other documents For details s...

Page 693: ...editing You can open a function or program from the current problem only Note You cannot modify a locked program or function To unlock the object go to a Calculator page and use the unLock command 1 Display the list of available functions and programs From the Actions menu select Open 2 Select the item to open Importing a program from a library You can import a function or program defined as a lib...

Page 694: ...of the current one The copy that you create is not locked even if the original is locked 1 From the Actions menu select Create Copy 2 Type a new name or click OK to accept the proposed name 3 If you want to change the access level select Library Access and select a new level Renaming a program or function You can rename and optionally change the access level of the current function or program 1 Fr...

Page 695: ...one To make function or program accessible from any document but not visible in the Catalog select LibPriv To make the function or program accessible from any document and also visible in the Catalog select LibPub Finding text 1 From the Actions menu select Find 2 Type the text that you want to find and click OK If the text is found it is highlighted in the program If the text is not found a notif...

Page 696: ...g Running programs and evaluating functions After defining and storing a function or program you can use it from an application All the applications can evaluate functions but only the Calculator and Notes applications can run programs The program statements are executed in sequential order although some commands alter the program flow The output if any is displayed in the application s work area ...

Page 697: ...red for a private library object you can open the library document or use the Program Editor to view the object You also can use getVarInfo to view a list of objects in a library Using a Public library function or program 1 Make sure you have defined the object in the document s first problem stored the object saved the library document in the MyLib folder and refreshed the libraries 2 Open the TI...

Page 698: ...ction or program Note All applications can evaluate functions but only the Calculator and Notes applications can run programs 3 Type the name of the object In the case of a function or program always follow the name with parentheses 4 If the object requires you to supply one or more arguments type the values or variable names inside the parentheses 5 Press Running a non library program or function...

Page 699: ...at the command where the break occurred Getting values into a program You can choose from several methods to supply the values that a function or program uses in calculations Embedding the values within the program or function This method is useful primarily for values that must be the same each time the program or function is used 1 Define the program 2 Run the program Letting the user assign the...

Page 700: ...4 mm and a radius of 5 mm Note You do not have to use the parameter names when you run the program but you must supply two arguments as values variables or expressions The first must represent the height and the second must represent the radius Requesting the values from the user programs only You can use the and commands in a program to make the program pause and display a dialog box prompting th...

Page 701: ...on the entry line and performing it in a function or program The following calculations for example do not display a result in a function or program although they do from the entry line Displaying information in the history You can use the command in a program or function to display information including intermediate results in the history Displaying information in a dialog box You can use the com...

Page 702: ...cases the variable i is used only while the program is running À Declares variable i as local Note When possible declare as local any variable that is used only within the program and does not need to be available after the program stops What causes an undefined variable error message An Undefined variable error message displays when you evaluate a user defined function or run a user defined progr...

Page 703: ... not likely to exist outside of the function or program Include DelVar within a program to delete the global variable if it exists before referring to it DelVar does not delete locked or linked variables Differences between functions and programs A function defined in the Program Editor is similar to the functions built into the TI Nspire Software Functions must return a result which can be graphe...

Page 704: ...an call another program as a subroutine The subroutine can be external a separate program or internal included in the main program Subroutines are useful when a program needs to repeat the same group of commands at several different places Calling a separate program To call a separate program use the same syntax that you use to run the program from the entry line Defining and calling an internal s...

Page 705: ...outine Lbl commands are local to the programs in which they are located Therefore a Goto command in the calling program cannot branch to a label in a subroutine or vice versa Avoiding circular definition errors When evaluating a user defined function or running a program you can specify an argument that includes the same variable that was used to define the function or create the program However t...

Page 706: ...al If EndIf structures let you execute a statement or block of statements conditionally that is based on the result of a test such as x 5 Lbl label and Goto commands let you branch or jump from one place to another in a function or program The If command and several If EndIf structures reside on the Program Editor s Control menu When you insert a structure such as If Then EndIf a template is inser...

Page 707: ...tional test is true and a different group if the condition is false use this structure À Executed only if x 5 Á Executed only if x 5 Â Displays value of 2x if x 5 5x if x 5 If Then ElseIf EndIf structures A more complex form of the If command lets you test for multiple conditions Suppose you want a program to test a user supplied argument that signifies one of four options If x 5 Then Disp x is gr...

Page 708: ...l it always branches to the specified label it is often used with an If command so that you can specify a conditional test For example À If x 5 branches directly to label GT5 Á For this example the program must include commands such as Stop that prevent Lbl GT5 from being executed if x 5 Using loops to repeat a group of commands To repeat the same group of commands successively use one of the loop...

Page 709: ...ariable used as a counter Á Counter value used the first time For is executed  Exits the loop when variable exceeds this value à Added to the counter each subsequent time For is executed If this optional value is omitted the increment is 1 When For is executed the variable value is compared to the end value If variable does not exceed end the loop is executed otherwise control jumps to the comman...

Page 710: ...s not automatically change the condition You must include commands that allow the function or program to exit the loop At the end of the loop EndWhile control jumps back to the While command where condition is re evaluated To execute the loop the first time the condition must initially be true Any variables referenced in the condition must be set before the While command You can build the values i...

Page 711: ...d does not have any arguments Typically you insert commands in the loop that let the program exit from the loop Commonly used commands are If Exit Goto and Lbl label For example À An If command checks the condition Á Exits the loop and jumps to here when x increments to 6 Note The Exit command exits from the current loop 0 x À While x 5 Disp x Á x 1 x  EndWhile Disp x à Loop EndLoop 0 x Loop Disp...

Page 712: ...n or program exit from the loop Changing mode settings Functions and programs can use the setMode function to temporarily set specific calculation or result modes The Program Editor s Mode menu makes it easy to enter the correct syntax without requiring you to memorize numeric codes Note Mode changes made within a function or program definition do not persist outside the function or program Settin...

Page 713: ... times use Disp to display the counter variable or the values in the conditional test To confirm that a subroutine is executed use Disp to display messages such as Entering subroutine and Exiting subroutine at the beginning and end of the subroutine To stop a program or function manually Windows Hold down the F12 key and press Enter repeatedly Macintosh Hold down the F5 key and press Enter repeate...

Page 714: ...702 Programming ...

Page 715: ...including TI Nspire Teacher Software TI Nspire Student Software TI Nspire CAS Teacher Software TI Nspire CAS Student Software TI Nspire Navigator Teacher Software TI Nspire Navigator Teacher Software for Networked Computers Chapter organization This chapter is organized using the following sections Introduction and navigation This is section you are in now Use this section to orient yourself to th...

Page 716: ...ith the Vernier DataQuest application Using sensors and data with other apps This section has information about using the Sensor Console a specialized view of the Vernier DataQuest application designed for using sensors with other TI Nspire applications Reference of menus The reference is a listing of the Vernier DataQuest menus with a brief description Note You can use the menu term under Data Co...

Page 717: ...product line images shown in this chapter are from a mixture of the software listed and are also from the computer and handheld Special instructions for PC users To access a Vernier DataQuest context menu move the cursor to the desired object and right click the object Special instructions for Macintosh users To access a Vernier DataQuest context menu move the cursor to the desired object hold and...

Page 718: ...bar select Insert Vernier DataQuest or select from the Welcome screen From a handheld select from the Home screen or Press and select Insert Vernier DataQuest from an open document The Vernier DataQuest application opens Understanding the computer view This is a general overview of the parts of the computer view An examination of the application screen sections will follow later The Document Toolb...

Page 719: ... with the TI Nspire CX handheld for more information An examination of the application screen sections will follow later À Click to activate the handheld view When activated the screen display emulates the display as shown on a handheld Illustrated in Understanding the handheld view Á Click to activate the computer view When activated the screen displays the default view for the computer  The sli...

Page 720: ...blem number followed by the page number Á Document name This shows the current document name You can click here to access the Document menu An asterisk by the document name indicates changes were made since the document was last saved  Status and Settings The battery level is shown here You can hover for the percentage value You can click on the icon for additional options à Close document Click ...

Page 721: ...is example the Graph View is displayed Á Data Set selection tool This tool displays in the Graph View only This tool allows you to choose which data set is graphed  View Details area This area contains information about the data appropriate for the current view à Data display area The primary display of the data The type of data displayed depends on the view Examples of each view will be covered ...

Page 722: ...m one view to another at any time Selecting Meter View When you first open the application Vernier DataQuest is in Meter View If one or more sensors are attached a meter is displayed for each Select View Meter or click The Meter View displays Selecting Graph View The Graph view is where you can visualize your data and use analysis tools Select View Graph or click The Graph View window is displayed...

Page 723: ...ion provides an overview of the typical process for performing an experiment The steps are brief with more detail on parameters and steps to follow later in the Experiment details section Note If you are reading this in the abbreviated application installed help please see the full reference guide Data Collection and Analysis chapter to access the additional sections referred to in these steps for...

Page 724: ...erent data collection options 3 Select Experiment New Experiment to reset sensor defaults This ensures the default data collection mode and the settings are set for the connected sensors and it removes any existing data Important This step is extremely important when you are not starting from a new document or problem 4 Optional Modify the data collection mode and data collection settings If desir...

Page 725: ...r more information Analyzing data to review common analysis features Working with advanced analysis features for additional analysis options Important Some information may be shown only in the All Details for Graph dialog box See Examining the View Details area data 9 Optional Perform additional data collection runs For most experiments it is desirable to perform multiple trials runs You can store...

Page 726: ...data views Experiment Details This section provides more detail to the procedure steps given in Performing an experiment This section includes Starting a new document of problem Connecting a sensor Data collection devices Setting and using a collection mode Modifying sensor settings Starting a data collection Using the keep option Stopping a collection Examining data points Data analysis options E...

Page 727: ...on the computer software Important The handheld can only have one document open If you do not save you will be asked if you want to save before creating a new document 2 Select File New TI Nspire Document or press Ctrl N Handheld Press c then select New Document 3 Select the Vernier DataQuest application from the menu A new document is opened Adding a problem You can add a new problem to an existi...

Page 728: ...nier EasyLink temperature probe for handhelds connect directly to the computer or handheld and do not need a sensor interface Data collection devices There are a variety of sensors and interfaces that can be used with your TI Nspire software running the Vernier DataQuest application Sensor Interfaces Texas Instruments TI Nspire Lab Cradle a multi channel sensor interface for use with handhelds or ...

Page 729: ...e sensors require a sensor interface Digital Sensors sensors such as motion detectors photogates radiation monitors and drop counters are digital sensors These sensors can only be used with the TI Nspire Lab Cradle Direct Connect USB Sensors These sensors connect directly to a handheld or computer and do not require a sensor interface For Handhelds Texas Instruments CBR 2 Vernier EasyTemp temperat...

Page 730: ...ollections The default collection mode is Time Based If you have unsaved data you will be warned that changing modes will clear your data This section examines the procedures for the collection modes Your options are Time Based The default for a new experiment Events with Entry Selected Events Photogate timing Only used with the Vernier Photogate sensor Drop Counting Only used with the Vernier Dro...

Page 731: ... For convenience you have two methods in which to enter this information Rate and Interval are simply reciprocals of each other Rate samples second Enter the number of samples per second The interval is calculated Interval seconds per sample Enter the number of seconds per sample The rate is calculated 3 Enter the rest of values in the Configure Time Based Data Collection dialog box Duration secon...

Page 732: ...in time base mode to emphasize specific points Use this option to identify points of interest such as an observed change or when changing the conditions while collecting data For example Ice begins to form began stirring or added a chemical 4 Click OK to save your entries Your settings are saved for use on your next run Using Time Based collection mode Use this procedure only after assigning Time ...

Page 733: ...d Optional units for the independent variable for your collection 3 Optional Select Average over 10 s seconds Use this option when sensor values fluctuate Ten seconds of data are collected and the average reading is retained 4 Click OK to save your entries Your settings are saved for use on your next run The Keep current reading icon now appears inactive in Data collection controls Using Events wi...

Page 734: ...int is saved in the appropriate location on the graph The next point appears in the center of the graph 4 Repeat step three until all your desired data points are captured 5 Stop the collection Setting Selected Events This collection mode allows you to capture samples manually Events with Entry and Selected Events are similar The difference is that Selected Events numbers the dependent column 1 2 ...

Page 735: ...vents collection mode 1 Connect a sensor 2 Select Experiment Start Collection or click Keep current reading becomes active The sensor shows the data point in the center of the screen when in Graph View 3 When ready click The data point is saved in the appropriate location on the graph The next point appears in the center of the graph 4 Repeat step three until all your desired data points are captu...

Page 736: ...s vary depending on the selected sensor For example options for the Vernier Go Temp Temperature probe are Fahrenheit Celsius and Kelvin Options for the Vernier Hand Dynamometer a specialized force sensor are Newton Pound and Kilogram To change a sensor s unit of measure 1 Select Experiment Set Up Sensors Change Units 2 Select the sensor you want to change the units Available sensor s are dependent...

Page 737: ...d to measure specific environmental conditions such as Temperature PH and CO2 cannot be zeroed To set the standing value to zero Select Experiment Set Up Sensor Zero The sensor value is now at zero If more than one attached sensor can be zeroed you will see a list of sensors to chose from along with an option to zero all sensors Reversing a sensor Use this feature to change the display of the read...

Page 738: ...aQuest application changes to Graph View and the recording of sensor data is enabled The graph is updated to show the collected data as it is occurring Important When using data modes Events with Entry or Selected Events data points are not recorded until you select Experiment Keep or click See Using the Keep option Using the Keep option Use the Keep option to store the connected sensor s values N...

Page 739: ...raph and Table views Defining Collection Mode as Events with Entry To set collection mode to Events with Entry 1 Select Experiment Start Collection or click 2 Select Experiment Keep or click for each data point you want to keep The Events with Entry dialog box opens 3 Enter the independent value in the Enter Value field Note Value is typically numeric but you can also use text 4 Click OK to contin...

Page 740: ... nature of your data This section includes Examining data points Interpolate Tangent Examine Settings Data analysis calculations Integral Statistics Curve Fit Model See Working with data and Graph View Also see Working with advanced analysis features Important The Graph menu and Analyze menu items are only available when working in Graph View Examining data points The following provides informatio...

Page 741: ...e by moving the cursor with your arrow keys or clicking on another data point Tangent Tangent is used to display a measure of the rate at which the data is changing at the point you are examining The rate value is displayed in the View Details area and in the All Details for Graph dialog box The value is labeled Slope To turn Tangent on and off 1 Select Analyze Tangent When Tangent is on a check m...

Page 742: ...a and in the All Details for Graph dialog box You can also show cursor position and delta values as you examine the data by selecting the Position and Delta option The values are displayed below the graph To examine settings 1 Select Analyze Examine Settings The Examine dialog box opens The default is to have all Show Examine items selected In this example there is one sensor column and a curve fi...

Page 743: ...temperature drop and how long did it take Plotted column name in this example Pressure Show the value and units of the displayed column 3 If examining the position and delta you may also select a region To select a region place your cursor at the start of the area Click and drag across the graph to the end of your selected region The selected area is indicated by gray shading See a following examp...

Page 744: ...g a range for instructions on how to select a range Notice that the value and units are shown and now position and delta values are also shown under the graph Data analysis calculations Integral Use Integral to determine the area under a data plot You can find the area under all of the data or a selected region of the data The value is displayed in the View Details area and in the All Details for ...

Page 745: ... associated with the plotted data Minimum maximum mean standard deviation and number of samples are calculated You can find the statistics for all the data or a selected region of data The values are displayed in the View details area and in the All Details for Graph dialog box To generate statistics 1 Leave the graph unselected to examine all the data or select a range to examine a specific area ...

Page 746: ... data The curve is drawn on the graph and the equation information is displayed in the View details area and in the All Details for Graph dialog box To generate curve fit 1 Leave the graph unselected to examine all the data or select a range to examine a specific area See Selecting a range for instructions on how to select a range 2 Select Analyze Curve Fit 3 Select the curve fit option from the m...

Page 747: ...example of curve fit Quadratic Curve fit option Calculated in the form Linear y m x b Quadratic y a x 2 b x c Cubic y a x 3 b x 2 c x d Quartic y a x 4 b x 3 c x 2 d x e Power ax b y a x b Exponential ab x y a b x Logarithmic y a b ln x Sinusoidal y a sin b x c d Logistic d 0 y c 1 a e bx d Natural Exponential y a e c x Proportional y a x ...

Page 748: ...els or enter your own To generate the model 1 Select Analyze Model 2 Enter your own function or select from drop down menu Example manually entered function 3 Click OK 4 Set the coefficient and increment values These are the initial values You can also adjust these values later with the sliders also called spinners in the View Details area ...

Page 749: ...or Graph dialog box Notice that the screen s minimum and maximum axis are too large for this particular example 6 Optional Adjust the window setting for minimum and maximum axis by clicking on the y and x minimum and maximum values directly on the screen to change or select Graph Window Settings Click OK when done See Setting Min and Max axis ranges ...

Page 750: ...ection and Analysis 7 Make any desired adjustments to the coefficients by clicking on or clicking directly on the value in the View Details area Example of a value entered directly Example model with values adjusted ...

Page 751: ...alyze Remove When there is only one item to remove the Remove option will include the name of the item available to be removed or the curve fit For example Remove Cubic When there is more than one item select the item to remove from the list provided Examining the View Details area data When you are performing analysis options such as statistics the All Details for Graph dialog box opens You can e...

Page 752: ... data included in the View Details area 1 Open the context menu in the View Detail area 2 Select Details All Details The All Details for Graph dialog box opens Use the scroll bar to see the rest of the data Other menu options under Detail context menu may be available These are subsets you can select if you only want part of the details Expanding the View Details area Use this procedure to expand ...

Page 753: ...s 741 1 Place your cursor at the edge of the View Details area and hover until the cursor changes to 2 Click and hold until cursor changes to 3 Drag until it is the size you desire In this sample the View Details area is resized ...

Page 754: ...following are example screens with the details shown To hide details Select Options Hide Details The menu changes from Hide Details to Show Details The following parts of the screen are hidden Vernier DataQuest application view tabs View Details area Data collection controls The following are example screens with the details hidden ...

Page 755: ... data The data set names can be changed Saving an experiment Save the document as a TI Nspire document tns file or as a TI Nspire PublishView document tnsp Important PublishView is a special application of TI Nspire that is only available on the computer software 1 Select the document to be saved 2 Select File Save Document or press Ctrl S Handheld Press then select File Save or press S Working wi...

Page 756: ...olumn Showing graphs The Show Graph menu option is used to show separate graphs when you Have a sensor that plots more than one column of data When multiple sensors having different defined units are used at the same time You can select to show the top graph bottom graph or both In these conditions the default is to show both graphs In this example two sensors the Gas Pressure sensor and the Hand ...

Page 757: ...s example both graphs are shown by default Showing Graph 1 Continuing with the same example as Showing Graphs this process shows how to display only Graph 1 Select Graph Show Graph Graph 1 Only Graph 1 is displayed Graph 1 is the top graph when both graphs are displayed ...

Page 758: ...lect Graph Show Graph Graph 2 Only Graph 2 is displayed Graph 2 is the bottom graph when both graphs are displayed Showing both graphs Continuing with the same example as Showing Graphs this process shows how to display both graphs if you have previously selected to show only Graph 1 or Graph 2 Select Graph Show Graph Both Both graphs are displayed ...

Page 759: ...ted with your graph 1 Select Graph Graph Title The Graph Title dialog box is opened When you have two graphs the dialog box has two title options 2 Enter the name of your title 3 Select Enable to show the title Note With the Enable option you can enter a graph name and turn it on or off as your needs change 4 Click Ok If enabled the title is shown ...

Page 760: ...mum range for the x and y axis using these procedures Setting the axis range using the menu 1 Select Graph Window Setting The Windows Setting dialog box opens When you have two graphs there are two y axis minimum and maximum values to enter but only one set of minimum and maximum values for the x axis ...

Page 761: ...es you want to change The application will use these new values for the graphs visual range until you modify or change data sets Setting the axis range from the window You can modify the minimum and maximum range for the x and y axis from the window ...

Page 762: ... one or more values to change by highlighting the text and typing a new value Handheld Place your cursor over the value until the cursor changes to an I beam Click the text to highlight and type your new value Press Handheld example screens ...

Page 763: ...ata Set or click on the Data Set selection tool The list of available data sets opens 2 Select one of the following Data Set name plot one data set All plot all data sets More Choose a combination of data sets to plot Click OK when Done When using the More option if you select more than one data set and less than all the Data Set selection tool will read Custom ...

Page 764: ...g a collection You have two options for the system s automatic autoscaling that occurs during a collection Use this procedure to set your choice 1 Select Options Autoscale Settings 2 Click the During Collection drop down list and select one Autoscale Larger This option expands the graph as needed to show all points as they are collected Do Not Autoscale With this option selected the graph window i...

Page 765: ...s now adjusted to only display your selected area The selected x range will be used as the new x range The y range will autoscale to show all graphed data points in the selected range The following images show an original autoscale view and zoom in performed multiple times or as a selected region Zoom Out 1 Select Graph Zoom Out or open the context menu on the graph and select Windows Zoom Zoom Ou...

Page 766: ...e your cursor at the start of the area Click and drag across the graph to the end of your selected region The selected area is indicated by gray shading Handheld Place you cursor at the starting point and click x center of the Touchpad The cursor changes to double headed arrow Move the cursor to the end of your selection Press d The cursor returns to å single headed arrow 2 Perform your action suc...

Page 767: ... The Point Options dialog box opens 2 Select your Mark option from the drop down box None No point protectors Regional Periodic point protectors All Display every data point as a point protector 3 Select or deselect Connect Data Points Selecting Connect Data Points displays a line between points The following shows examples of some of the point Mark options Regional Connect Data Points Selected Al...

Page 768: ...n color handheld the color is represented by different shades of gray 1 Open the context menu in the Graph and select Color from the menu Note The Color option is often preceded by the data set name and column name 2 Select the column variable to change 3 Select the color to set In this example Force was selected and green was the color chosen ...

Page 769: ...ect Point Marker from the menu Note If there is only one dependent variable column the Point Maker option is preceded by the data set name and column name Otherwise the Point Marker option has a menu 2 Select the column variable to change 3 Select the point marker to set In this example Pressure was selected and the inverted fill triangle was the point chosen ...

Page 770: ...d your graph is reordered using the new independent variable for graphing the data Selecting a dependent variable column The option Select Y axis Column allows you to select which dependent variable columns to plot on the displayed graph s 1 Select Graph Select Y axis Column 2 Select one of the following A variable from the list The list is a combination of your dependent variables and the number ...

Page 771: ...l column Adding a calculated column Creating a new data set Defining column options Set the column name units and precision here All existing columns are listed To define the column 1 Select View Table or click You can be in the Meter Graph or Table views and still perform these steps The results will still be visible The Table View is displayed In this example no data sets have been run and the V...

Page 772: ... in graphs and detail boxes Displayed Precision Specifies the number of decimal places or significant values This default precision is related to the precision of the sensor Link to List Allows the system to link columns to the symbol table and make the variable such as run1 x available to other TI Nspire applications outside of the Vernier DataQuest application Linking is the default for most sen...

Page 773: ...761 In this example the name was changed to Pressure Ex01a and the displayed precision was set to 4 4 Click OK The column settings are now defined with your new values The following example shows some views after a data collection ...

Page 774: ...he column headings also in the Data Set selection tool and the Details View area 1 Select View Table or click 2 Open the context menu for the table s data set name for example Run1 3 Select Options preceded by the data set name The Data Set Options dialog box opens 4 Change the name Note The maximum character limit is 30 and the name cannot contain commas The data set name is now changed ...

Page 775: ... The Column Options dialog box opens 2 Enter the values you want to edit Most fields are populated but still allow editing Name Enter the long name for the column Short Name The preferred abbreviation for a column where the column has not been expanded large enough to show the full name Units Enter the unit label The label is used when values from this column are displayed in graphs and detail box...

Page 776: ...re application on an additional page such as List Spreadsheets The list is only populated when data exists in the other application and includes a column label Link to List Allows the system to link columns to the symbol table and make the variable such as run1 x available to other TI Nspire applications outside of the Vernier DataQuest application Linking is the default for most sensors Note Hear...

Page 777: ...s Displayed Precision Significant Figures Specifies the number of decimal places or significant values Expression Enter an expression that includes one of the column names provided The system provided column names are dependent on the sensor s selected and any changes made to the name field in Column Options Important The Expression field is case sensitive Example Pressure is not the same is press...

Page 778: ...e Heart rate and blood pressure sensors require a tremendous amount of data to be useful and the default for these sensors is to be unlinked to improve system performance Example with fields 3 Click OK The new calculated column is created ...

Page 779: ...etting up an offline sensor Selecting a remote collection unit Collecting remote data Retrieving remote data Setting up triggering Setting up an offline sensor The Add Offline Sensor option provides you with a method of setting collection parameters and changing units for a sensor that is not currently attached You cannot use an offline sensor but you can prepare it for use before it is attached T...

Page 780: ...I Nspire Lab Cradle TI CBR 2 and Vernier Go Motion support remote data collection Parameters for collection setup will use current values Desired edits must be performed before this procedure See Setting and using a collection mode To select the collection unit 1 Set up your experiment for data collection 2 Select Experiment Advanced Set Up Remote Collection 3 Select the data collection device you...

Page 781: ...y value Setting the delay at zero allows you to use the manual trigger button on the lab cradle to start your collection See Using the manual trigger to start the collection 5 Click OK 6 When ready the Remote Setup dialog box is opened A message informs you how to start the collection and that it is safe to disconnect the data collection device The following is an example message with the delay se...

Page 782: ... as a stand alone collection tool for remote collection the data collection parameters must first be set in the Vernier DataQuest application as described in Setting up the lab cradle for remote collection Note See the TI Nspire Lab Cradle Guide included with the lab cradle for more information If you do not have the TI Nspire Lab Cradle go to education ti com to learn more and how to purchase Set...

Page 783: ...uments are open 2 Attach a sensor to the TI Nspire Lab Cradle 3 Attach the TI Nspire Lab Cradle to the computer or handheld 4 Set up your experiment as desired 5 Navigate to Experiment Advanced Set Up Remote Collection TI Nspire Lab Cradle 6 Review the settings Verify the delay is at zero no delay Setting the delay at zero allows you to use the manual trigger button on the lab cradle to start your...

Page 784: ... data see Retrieving data from remote data collection Using a delay to start the collection 1 Save and close any open documents When performing experiments it is recommended that you have only one document open The system cannot determine which of the documents to use with the sensor if multiple documents are open 2 Attach sensor to the TI Nspire Lab Cradle 3 Attach the TI Nspire Lab Cradle to the...

Page 785: ...elay value to start the collection 8 Select OK when you are ready to begin the countdown A message displays stating the countdown has begun 9 Disconnect the cradle 10 Proceed to collect your data 11 At some point after the collection click OK on the Remote Setup dialog box After you have collected your data see Retrieving remote data Retrieving remote data Use this procedure for retrieving the rem...

Page 786: ...ata is now in the Vernier DataQuest application Setting up Triggering Data collection can be set to start based on a specific sensor reading This functionality is only available when using the TI Nspire Lab Cradle Setting up the sensor for triggering Set the sensor and the threshold type for the system to use when analyzing when the trigger is reached so it can start the data collection You must h...

Page 787: ...n decreasing values Enter the trigger threshold in units of the selected sensor When entering the value to start the trigger enter a value within the range of your sensor The value should be in regards to the current sensor units you are using If you change the unit type after setting the threshold the value will automatically be updated For example if using the Vernier Gas Pressure sensors units ...

Page 788: ... you can enable the trigger Select Experiment Advanced Set Up Triggering Enable The trigger is now active Disabling the trigger You can disable the active trigger Select Experiment Advanced Set Up Triggering Disable The trigger is no longer active Working with advanced analysis features This section examines features not as commonly used when performing experiments but are valuable to know about a...

Page 789: ...n starts and the Data Collection Control buttons change to Stop Playback Pause and Advance by One Point The Advanced by One Point button and menu item is inactive until you pause the replay Pausing and resuming the playback To pause the playback Select Experiment Replay Pause or click The following events occur The playback is paused The menu option changes to Resume The button changes to The menu...

Page 790: ... field click to open the drop down menu 3 Select the rate at which the playback will play Normal speed is 1 00 Less is slower higher is faster 4 Decide whether you want to repeat the playback 5 Select one of the following Click Start to start the playback and save your settings Click OK to save you settings for use on your next playback Selecting a data set to replay You can only replay one data s...

Page 791: ...ote Data Set and Base Column options are dynamic depending on number of stored runs and sensor type used Note Changing the run in the Data Set selection tool will not affect the playback choice You must specify which data set in Experiment Replay Advanced Settings Data Set selection tool If you set the replay for run2 and switch to run1 you will not see the data replayed Striking and restoring dat...

Page 792: ...splayed select the region you want to strike or to protect from the strike See Selecting a range for instructions on how to select a range Note You have the option to strike all data in the selected region or strike all data outside the selected region 4 Select Data Strike Data or open the context menu in the graph and select Strike Data Handheld Click b and select Data Strike Data or click b and ...

Page 793: ...rt this procedure open the data run that contains the data to be struck 2 Select View Table or click 3 Select your starting row and scroll to your ending point To select the region Strike results In Selected Region selected Strike results Outside Selected Region selected ...

Page 794: ...nd holding until the cell is filled Release and move your cursor across cells until the row is selected Move your cursor to the bottom or top of the screen to select the rest of your region In this example row 21 is selected as the beginning area and row 147 as the end 4 Select Data Strike Data or open the context menu in the table and select Edit Strike Data Handheld Select b then Data Strike Dat...

Page 795: ... Analysis 783 Outside Selected Region Strike all data except the area you selected You can switch views and still see the results Strike results In Selected Region selected Strike results Outside Selected Region selected ...

Page 796: ...dit Restore Data 3 Select one of the following In Selected Region Restore data in your selected area Outside Selected Region Restore data outside your selected area All Data Restore all data No selection necessary Adjusting derivative settings Use this option to select the number of points used in derivative calculations This value affects the tangent tool velocity and acceleration values 1 Select...

Page 797: ...g points to your graph Drawing the prediction To draw the prediction 1 Select Analyze Draw Prediction Draw 2 Move your cursor over the graph clicking at each area you want to place the point 3 Click the Esc key to release Handheld Press d to release The following image is an example of a drawn prediction Clearing the prediction To clear the drawn prediction Select Analyze Draw Prediction Clear ...

Page 798: ...ion detector 2 Select View Graph or click 3 Select Analyze Motion Match 4 Select one of the following New Position Match Generates a random position plot New Velocity Match Generates a random velocity plot The following image is an example of the Motion Match New Velocity Match generated plot Note You can keep selecting a new position or a new velocity match to generate a new random plot without r...

Page 799: ...s that use the same column s of data In these situations the Page Layout functionality is useful Note See the chapter Using multiple applications on a page for more information about Page Layout To use Page Layout 1 Open the original data set you want to see in two graph windows In this example the data set is using two of the same sensors 2 Select Edit Page Layout Selected Layout or click Handhel...

Page 800: ...ext reads Press Menu Click in the window and press b 5 Select Add Vernier DataQuest from the drop down menu This example screen shows two running Vernier DataQuest applications 6 To see separate views click the view you want to change and select View Table or the view you want or click The window displays your change ...

Page 801: ...ct View Graph or the view you want or click The window displays your change To show the plots separately 8 Click the top graph to select it 9 Select Graph Select Y axis Columns 10 Select the first Pressure value or unit you are working with Note Selection in one view is reflected in the other ...

Page 802: ...Data Collection and Analysis The graph now displays only one of the columns 11 Select the bottom application and repeat steps nine and ten but select the second data value The application shows the changes ...

Page 803: ...lso use the same procedure for graphs with multiple runs To use procedure for multiple runs Repeat steps one through seven Set the Data Set selection tool for the runs on each graph Your window will look similar to the window is the following example ...

Page 804: ...iews or a combination of the data views when printing Select Options Print All Settings to determine which view s will be printed when you select Print All as your print selection By default if not set only the displayed view will be printed The Print All option has no affect in applications outside of the Vernier DataQuest application Handheld You can use this option to set the printing options f...

Page 805: ... print Click OK The Print All settings are now complete and can be used when printing The following image is an example of the More setting In this example the Graph and Table view are set to print when Print All is selected and the print command is executed Printing Printing can only be performed on the computer 1 Select File Print 2 Select Print All from the Print What drop down menu 3 Complete ...

Page 806: ...r Console is a specialized view of the Vernier DataQuest application designed for using sensors with other TI Nspire applications such as Graphs Geometry and Data Statistics Sensor Console works with the following applications Graphs Geometry Data Statistics Lists Spreadsheet When performing experiments it is recommended that you have only one document open The system cannot determine which of the...

Page 807: ...Attach the sensor to use if not already attached Wait a moment for the Sensor Console area to appear active 4 Click Collect Data Start Collections or click 5 Wait for the data set to end or stop the collection Computer To stop collection Collect Data Stop Collection or click Handheld To stop collection Press b and select Collect Data Stop Collection or click 6 Click Collect Data Close Console or c...

Page 808: ... Click anywhere on the Sensor Console bar to see the Sensor Console Menu Collect Data 2 Select Collect Data The Sensor Console application menu opens Accessing the menu on the handheld 1 Click anywhere on the Sensor Console area and click b to see the Sensor Console menu Collect Data 2 Select Collect Data The Sensor Console application menu opens ...

Page 809: ...he context menu on the computer To Access the Sensor Console context menu from an application running Sensor Console Right click the Sensor Console bar The Sensor Console context menu opens Accessing the context menu on the handheld To Access the Sensor Console context menu from an application running Sensor Console 1 Click on the Sensor Console bar 2 Press b The Sensor Console context menu is ope...

Page 810: ...ent with your captured data set For example open the Graphs application 2 Select Insert your other application For example insert Lists and Spreadsheet Your selected application opens 3 Select Insert Sensor Console The Sensor Console area is opened at the bottom of the application In this example a sensor is attached but it doesn t have any affect on this procedure ...

Page 811: ...or Console area Handheld Click in the Sensor Console area Press b then Collect Data View Data in Apps on Current Page or click in the Sensor Console area and click b and then select View Data in Apps on Current Page Wait until the data is populated After a few moments the data is displayed 5 Select Collect Data Close Console ...

Page 812: ...al steps required to organize the points The following image is an example of existing data opened as a Dot Point graph in the Data and Statistics application This procedure assumes you have already collected data in another application 1 Open the Data and Statistics application with the existing data 2 Click on the y axis side of the text on the screen Click to add variable 3 Select the variable ...

Page 813: ...801 5 Select the variable The data is replotted Reference of Menus Vernier DataQuest application menus The following is a list of the Vernier DataQuest application menus and a brief explanation of their functions for your reference ...

Page 814: ...nsor s values Keep stores a specific data point This option is available when Events with Entry or Selected Events is specified for the Collection Mode option Extend Collection value s Extend Collection value s value represents the new data collection duration after the extend has been selected s represents the time unit seconds This option extends the duration of an active experiment It is only e...

Page 815: ...ols area In Events with Entry you define the value Selected Events Capture samples manually every time Keep current reading is selected from the Graph View data collections controls area In Selected Events the x value will automatically be the sample number Photogate Timing Used only with a Photogate sensor Drop Counting Used only with Drop Counter sensor Collection Setup Configure the data collec...

Page 816: ...of sensor reading This only available for sensors where direction is relevant for example motion detectors and force sensors Advanced Setup Set up more advanced data collection options including remote collection and triggering Remote Collection Set up supported data collection devices for data collection without a handheld or computer Supported devices TI Nspire Lab Cradle TI CBR 2 and Vernier Go...

Page 817: ...ollection and Analysis 805 Add Offline Sensor The offline option provides the teacher or student with a method of setting up the sensor without actually having to attach the sensor Menu Experiment Description ...

Page 818: ...ed from an expression using at least one of the existing columns New Data Set Create a new data set having the same columns as the existing data set s Column definitions from the latest data set are applied to the new data set Strike Data Mark data that should be ignored when graphing data or performing computations In Selected Region The data that is in the selected region will be struck Outside ...

Page 819: ...at plot more than one column of data or when multiple sensors have defined units that are different are used at the same time Graph Title Add a title to the displayed graph s Select X axis Column Select the column used as the independent variable when graphing the data Note This column is used for all graphs Select Y axis Column Select which dependent variable columns to plot on the displayed grap...

Page 820: ...toscale Now Rescales the graph so that all points from the plotted y scale columns will be displayed on the graph Available anytime there is data on the graph Zoom in Zoom in view If a region of the graph is selected the selected x range will be used as the new x range The y will autoscale to show all graphed data points in the selected range Zoom Out Zoom Out view If Zoom In precedes a Zoom Out Z...

Page 821: ...the data Values are displayed in the View details area You can also show cursor position and delta values as you examine the data by selecting the Position and Delta option The values are displayed below the graph Integral Use to determine the area under a data plot You can find the area under all of the data or a selected region of data The value is displayed in the View details area and in the A...

Page 822: ... d Quartic This fit is calculated in the form of y a x 4 b x 3 c x 2 d x e Power ax b This fit is calculated in the form of y a x b Exponential ab x This fit is calculated in the form of y a b x Logarithmic This fit is calculated in the form of y a b ln x Sinusoidal This fit is calculated in the form of y a sin b x c d Logistic d 0 This fix is calculated in the form of y c 1 a e bx d Natural Expon...

Page 823: ...aph Draw Manually set data points Line appears between data points Clear Clears data points and lines created Motion Match Creates a randomly generated plot on position vs time or velocity vs time graphs Only available when using a motion detector like the CBR 2 sensor or the Go Motion sensor Remove Match Remove motion match plots New Position Match Add a motion match plot to the position vs time ...

Page 824: ...ter data collection Derivative Settings Select the number of points used in derivative calculations This value affects the tangent tool velocity and acceleration values Print All Settings Use to determine which Vernier DataQuest view s will be printed when Print All is selected within the TI Nspire software Note Specifying the print settings can be done from the computer or handheld however printi...

Page 825: ...Data Set Creates a new data set for subsequent data collections so collected data is not overwritten This is only available when data is present The data set is not saved permanently until you save the document file Keep Stores the current connected sensor s values Keep stores a specific data point This option is available when Events with Entry or Selected Events is specified for the Collection M...

Page 826: ...samples manually every time Keep current reading is selected Selected Events Capture samples manually every time Keep current reading is selected Photogate Timing Used only with a Photogate sensor Drop Counting Used only with Drop Counter sensor Collection Setup Configure the data collection Set Up Sensors Use to modify the values returned by the sensor View Data in Apps on Current Page View exist...

Page 827: ... to zero Meter Display Displays the values to appear in the Sensor Console view of the meter such as Name Unit and the displayed precision Collection Settings Displays the data collection parameters for the current mode This option also provides buttons for you to configure the data collection parameters such as Mode Rate Interval and Duration View Data In Apps on Current Page Displays the data pr...

Page 828: ...816 Data Collection and Analysis ...

Page 829: ...ions are Handheld only Keypad plus side screen Handheld plus side screen In the student software the TI SmartView emulates the keypad which along with the handheld view gives students the ability to drive the software as if using a handheld Opening the TI SmartView emulator The TI SmartView emulator is located in the Documents Workspace To open the emulator view 1 Open the Documents Workspace 2 Cl...

Page 830: ...ypad is displayed with the side screen open in computer mode You can use the keypad on the emulated handheld but the document won t appear on the emulated handheld screen until you switch to Handheld mode 3 Select View Handheld or click in the status bar to switch to handheld mode ...

Page 831: ...oftware window 1 In the emulator panel click or select File Settings TI SmartView from the menu bar to open the drop down menu 2 Select one of the following options Handheld Only displays the emulated handheld and hides the work space and other panels Note To keep the Handheld Only display in front of other application windows click Always in Front at the top right of the TI SmartView panel Keypad...

Page 832: ...d and click b on the emulator to open a context menu For the most part you can perform any function in the TI SmartView emulator that you can perform on the handheld Keys and applications operate the same way Note If you switch to Computer mode you can still use most of the keys on the emulated handheld or keypad and all keystrokes are reflected in the work space However some key combinations may ...

Page 833: ...he mouse across the Touchpad area enables you to move the mouse pointer Clicking the middle of the Touchpad selects the highlighted menu option Using the Clickpad You can use the Clickpad on the TI Nspire Clickpad keypad using either the touchpad on a laptop or by using the mouse to click the Clickpad Areas of the Clickpad are highlighted as you click the arrow zones Clicking the or keys on the Cl...

Page 834: ...losed 1 In the teacher software select File Settings TI SmartView Options The TI SmartView Options dialog box opens Setting or Settings Description Language You can open the languages drop down menu and select a language but you cannot save changes To change the language use the TI Nspire menu File Settings Change Language Handheld Setup You can open the drop down menus and select items to demonst...

Page 835: ...a view If selecting Handheld only check Always in Front to keep this window on top of all other open applications Working with documents You can open multiple documents in the workspace by selecting File Open Document from the menu or using keyboard shortcuts When you switch between these documents the emulated handheld shows only the current document You can insert pages and problems using either...

Page 836: ...ve files up in the file path Saving a document When you save a document using the File Save Document menu or icon keyboard shortcuts keypad shortcuts or emulator menus the document is saved in the same location where the file was opened To save the file in another location or with a different name click File Save As Using Screen Capture To capture the current page press Ctrl J Macintosh ì J on you...

Page 837: ...ation If this equipment does cause harmful interference to radio or television reception which can be determined by turning the equipment off and on the user is encouraged to try to correct the interference by one or more of the following measures Reorient or relocate the receiving antenna Increase the separation between the equipment and receiver Connect the equipment into an outlet on a circuit ...

Page 838: ... receiver Connect the equipment into an outlet on a circuit different from that to which the receiver is connected Consult the dealer or an experienced radio TV technician for help FCC Caution The TI Navigator Access Point TI Nspire Navigator Cradle and TI Nspire CX Wireless Network Adapter comply with Part 15 of the FCC Rules Operation is subject to the following two conditions 1 These devices ma...

Page 839: ...e interference and 2 these devices must accept any interference including interference that may cause undesired operation of the device To prevent radio interference to the licensed service i e co channel Mobile Satellite systems these devices areintended to be operated indoors and away from windows to provide maximum shielding Equipment or its transmit antenna that is installed outdoors is subjec...

Page 840: ...this symbol indicates compliance with the Essential Requirements of the R TTE Directive of the European Union 1999 5 EC This equipment meets the following conformance standards Safety EN 60950 1 2001 A11 2004 EMC EN 55022 2006 EN 55024 1998 A1 2001 A2 2003 EN 301 489 1 v1 7 1 EN 301 489 17 v1 3 2 CISPR22 1997 CISPR24 Including EN 61000 3 2 3 3 4 2 4 3 4 4 4 5 4 6 and 4 11 The product is also licen...

Page 841: ...tor adgangspunktet den trådløse TI Nspire Navigator holder og den trådløse TI Nspire CX netværksadapter er i overensstemmelse med de essentielle krav og andre relevante bestemmelser i direktiv 1999 5 EF Du kan læse overensstemmelseserklæringen på produktforvaltningssiden på education ti com Norsk Texas Instruments erklærer herved at TI Navigator tilgangspunkt TI Nspire Navigator trådløs bordholder...

Page 842: ...erklärung kann auf der Seite Engagement für die Umwelt unter education ti com angezeigt werden Italiano Con la presente Texas Instruments dichiara che il punto di accesso TI Navigator la base di ricarica wireless TI Nspire Navigator e la basetta wireless TI Nspire CX sono conformi ai requisiti fondamentali e ad altri provvedimenti della Direttiva 1999 5 CE È possibile consultare la Dichiarazione d...

Page 843: ...unto de acceso TI Navigator el soporte inalámbrico TI Nspire Navigator y el adaptador de red inalámbrica TI Nspire CX cumplen con los requisitos esenciales y otras disposiciones relevantes de la directiva 1999 5 CE Puede consultar la declaración de conformidad en la página Administración de producto en education ti com Svenska Texas Instruments deklarerar härmed att TI Navigator anslutningspunkt T...

Page 844: ...quencies associated with channels 1 to 13 in the 2 400 to 2 4835 GHz band are allowed to be used either indoors or outdoors in all countries of the European Community except where noted below In Greece Italy Latvia and Spain the end user must apply for a license from the national spectrum authority to operate this device outdoors Please consult the TI Nspire Navigator Teacher Software Guidebook fo...

Page 845: ...with any antenna s other than those furnished by Texas Instruments An intentional radiator may only be operated with the antenna s with which it is authorized Warning The TI Navigator Access Point radio s are disabled by default and can be enabled only by the system administrator using the Management software application Warning The radio frequency band operating channels and transmit power depend...

Page 846: ...834 Regulatory Information ...

Page 847: ... TI by e mail or visit the TI Internet address Service and warranty information For information about the length and terms of the warranty or about product service refer to the warranty statement enclosed with this product or contact your local Texas Instruments retailer distributor Home Page education ti com KnowledgeBase and e mail inquiries education ti com support Phone 800 TI CARES 800 842 27...

Page 848: ...836 ...
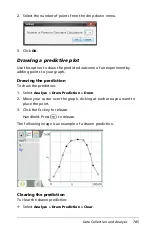
Page 849: ... list 76 lists questions 304 Master Document 373 Notes to a page 645 open response questions 298 questions 295 296 students to classes 249 teacher data to responses 351 adding a copyright 145 Adding a problem PublishView TM 198 adding an application to a problem 194 Adding color from a list 140 Adding color from a palette 140 adding hyperlink 210 adding images 212 Adding multiple applications to a...

Page 850: ...ta Statistics 169 Geometry 169 Graphs 169 Notes 169 Question 169 Applying a background color 649 Applying a text format 648 approximate results 404 approximating expressions 653 area of a circle 516 of a polygon 516 of a rectangle 516 of a triangle 516 Area tool 516 arranging captured screens 154 arranging seating chart 254 assignments pane 364 assignments summary 364 365 attach Graphs Geometry 45...

Page 851: ...0 Capturing a student handheld 148 capturing pages 141 Catalog 385 converting measurement units 412 inserting items from 139 385 387 405 408 552 569 catalog 137 categorical variable Data Statistics 594 categories sorting 621 splitting numeric plot 617 cell references absolute and relative 551 using in a formula 552 cells copying in a table 552 filling adjacent 553 linking to a variable 431 554 sel...

Page 852: ...ts 140 column clearing data from 556 inserting into a matrix 408 column actions 365 columns based on other columns 558 copying in a table 555 deleting from a table 555 generating data in tables 557 inserting in a table 555 linking to a list variable 547 moving in a table 556 resizing 554 selecting in a table 554 sharing table column as a list 546 comment 679 comments 650 inserting in Notes applica...

Page 853: ...ecking LEDs 5 connecting to handhelds 16 removing from network 14 creating a system of equations 411 classes 246 code snippet 238 folders 126 functions and programs 414 lists from a table column 546 matrices 407 piecewise functions 410 user defined units 413 variables 425 Creating a new PublishView TM document 178 Creating a new TI Nspire TM document 120 creating a point 500 creating a point on an...

Page 854: ...762 change units 724 803 collect data Sensor Console 813 collection mode 718 803 setup 803 column options 759 806 configure sensor 767 804 curve fit 734 810 derivative settings 784 812 draw prediction 785 811 drop counting 724 803 events with entry 721 803 examine settings 730 809 graph graph 1 745 807 graph 2 746 807 graph title 747 807 view 710 812 in selected region 779 806 restore 784 806 inte...

Page 855: ... 749 808 with other apps 794 zero 725 804 zoom in 753 808 out 753 808 data types variables 426 Data View pane 332 hiding responses 345 live results 332 view data 337 deactivating math expression boxes 655 dedicating TI Nspire TM Document Player window 242 deferring evaluation in Calculator 411 define work area window Data Statistics 597 defined function recalling 418 defining 3D graph 533 function...

Page 856: ...m emulator 823 documents in tiled view 127 Documents Toolbox PublishView TM 184 Documents workspace 83 menu 106 draw option example 640 Draw output option 570 drop points questions adding 302 E edit mode PublishView TM 207 Edit Relation on context menu Graphs Geometry 451 editing a 3D graph 534 Destination folder 78 math expressions 390 418 scores 369 values in a list 547 editing a hyperlink 210 e...

Page 857: ... Web Page 233 exporting results from Portfolio 371 exporting HTML to the clipboard 238 Exporting to a web page 233 expression templates using 139 405 552 expressions 652 approximating 653 copying from Calculator history 390 421 422 deleting part of 419 editing 390 418 entering and evaluating 384 404 entering from a template 386 407 entering in a table 549 entering with a wizard 387 408 569 evaluat...

Page 858: ...fined 691 working with Graphs Geometry 470 G Gallery view 153 generating data in tables 557 generating HTML source code 233 Geometry 169 global variables 691 go to Goto 693 696 700 grading questions 369 Graph Trace tool Data Statistics 597 Graph Type Menu tools Graphs Geometry 443 graphing 3D functions 533 differential equations 480 table data 561 graphing inequalities 485 Graphs 169 Graphs Geomet...

Page 859: ...ting to clipboard 238 generate code 233 HTML code for iframes 223 HTML document 233 HTML inline frames 222 hyperlink adding 210 editing 210 remove 211 hyperlinks in PublishView TM 207 I icons Review workspace 355 Identify Selected 51 identifying an equation 513 if If 694 695 iframe frameborder 224 height 224 scrolling 224 width 224 iframe attributes 224 source 223 iframe source code 222 iframe tag...

Page 860: ...w TM 189 inserting an image 171 Clipboard 173 context menu 173 Insert command 172 original image is replaced 171 pasting 173 Inserting Images 649 inserting images 212 inserting items from the Catalog 385 Inserting math expressions shapes or comments 650 inserting text Data Statistics 595 inserting text in headers and footers 201 inserting text into a text box 205 installing handheld software 6 int...

Page 861: ...43 removing linked variables 437 links toolbar 41 list data organizing 341 lists capturing Graphs Geometry data 566 deleting elements in a table 548 inserting elements in a table 548 sharing table columns as 546 storing as variables 426 viewing and editing 547 Lists Spreadsheet adding to a page 546 getting started with 541 variables 430 431 433 Lists Spreadsheet toolbar 542 lists questions adding ...

Page 862: ...ons 650 editing 390 418 entering and evaluating 384 404 entering in a table 549 selecting in Calculator 390 419 with multiple statements 432 math operators 138 math templates 136 using 139 405 552 matrices creating 407 storing as variables 426 matrix inserting a row or column 408 maxima finding 492 522 Measurement Menu tools Graphs Geometry 447 measurement units converting 412 measurements finding...

Page 863: ...and folders 125 N names changing 257 naming table columns 546 naming objects during construction 503 naming variables preventing name conflicts 554 navigating in a table 546 network logging in 24 setting up 8 normal probability creating plot 609 Normal Probability plot Data Statistics 592 Notes 169 adding to a page 645 inserting comments in 650 PublishView TM 205 selecting text 648 toolbar 645 nsp...

Page 864: ...age sorter 133 panning views 462 Parallel Line tool 506 parameters nspirefile 223 240 pass error PassErr 701 passwords changing for teacher 22 resetting for students 271 pasting table data 564 pasting a screen 166 pasting images 173 pasting problems 135 pause Pause 701 performing an experiment 711 perimeter finding 515 Perpendicular Line tool 507 Perpendicular Bisector tool 526 picture as backgrou...

Page 865: ...sults 404 pre defined measurement units 412 preview pane 39 printing previewing 144 printing captured screens 159 Printing documents 143 printing PublishView TM documents 219 probability creating plot 609 problem adding to PublishView TM 194 problems 134 adding pages 135 adding to documents 134 copying 135 deleting 135 pasting 135 PublishView TM 198 renaming 135 Program Editor overview 673 program...

Page 866: ...aging problem breaks 199 menus 186 moving text box 191 new document 178 printing documents 219 problems 198 remove hyperlinks 211 renaming a problem 199 resize text box 190 showing problem breaks 199 software requirements 177 status bar 182 toolbar 186 using Notes 205 video console 215 video file links 214 video files 214 working document 196 PublishView TM documents 179 PublishView documents 119 ...

Page 867: ...Data Statistics 596 removing classes 249 files from Portfolio 375 students from classes 251 variables 437 removing a hyperlink 211 removing adapters or cradles from network 14 removing files from Transfer list 77 renaming problems 135 Renaming a problem PublishView TM 199 renaming functions 485 renaming Portfolio items 375 replacing text in Program Editor 683 repositioning a measured value 517 req...

Page 868: ...aving handheld documents in the software 126 saving handheld screens 165 saving Scratchpad contents 396 Saving screens using Capture Class 158 Saving TI Nspire TM documents 121 scale indicator showing and hiding 462 scaling 94 science data collection 703 performing an experiment 711 scores 369 changing 369 370 scoring questions 369 Scratchpad saving 396 Screen Capture 141 Accessing 147 Capture Cla...

Page 869: ...Notes 651 creating 509 511 Shapes Menu tools Graphs Geometry 447 sharing a table column as a list 546 Live Presenter recording 290 table column as a list 546 table cell values 553 sharing documents 239 sharing documents online 239 sharing files offline 242 shortcuts 41 adding 41 deleting 41 Show Normal PDF Data Statistics 597 Show Student Names 149 showing 3D graphs 536 handheld in Live Presenter ...

Page 870: ...e Presenter recording 289 stopping polls 318 storage site online 229 stored variables linking to 431 storing document 239 storing file offline 242 strings storing as variables 426 student handheld capturing 148 student information sorting 255 student list changing class view 253 Student pane hiding responses 344 viewing data 337 student pane Review workspace 329 student responses hiding 343 indivi...

Page 871: ...cher data adding to responses 351 teacher handheld displaying 152 Teacher Preferences 152 Teacher Tool Palette 293 template selecting 646 source code 234 templates Proof 646 Q A 646 using 386 407 text add to PublishView TM document 205 adding to a Graphs Geometry page 521 convert to hyperlink 211 editing and formatting 207 finding and replacing in Program Editor 683 finding in Program Editor 683 f...

Page 872: ...en Capture 150 tool bars TI Nspire TM Document Player 229 TI Nspire TM Screen Capture window 163 toolbar Content Workspace 35 63 Documents workspace 106 links 41 Notes 645 PublishView TM 186 Review workspace 355 using in Calculator 404 toolbars Calculator 398 Lists Spreadsheet 542 toolbox Review workspace 327 Tools Angle 516 Angle Bisector 527 Area 516 Attributes 458 459 530 Calculate 521 Dilation...

Page 873: ...its converting measurement uints 412 creating user defined 413 unpinning objects Graphs Geometry 451 498 user name changing for teacher 23 user defined functions 691 using TI Nspire TM Document Player 226 Using Capture Class 148 Using color in notes 648 Using Content Explorer to locate files 122 using export to generate HTML source code 233 using hyperlinks 207 Using Screen Capture 141 Using templ...

Page 874: ... history 286 poll results 319 values in a list 547 viewing captured screens 162 viewing copyright information 144 Viewing document properties 144 viewingembeddedPublishView TM documents 221 viewing embedded TI Nspire TM documents 221 viewing embedded web pages requirements 221 viewing the source code 233 views 462 in Graphs Geometry 460 W warnings showing 654 Web Content 44 web page create 233 exp...

Page 875: ...Graphs Geometry 470 working with images 212 Working with problems 198 Working with problems and pages 134 Working with PublishView TM documents 177 working with PublishView TM documents 179 working with video files 214 workspaces 30 31 Class 245 Content 35 Documents 83 Portfolio 363 Review 325 Y y functions graphing 484 Z zeroes finding 492 522 zoom in 156 164 zoom out 156 164 zoom percentage 156 ...

Page 876: ...864 You should upgrade your computer software and calculator OS regularly to take advantage of all the newest features and functionality ...

Reviews: