Graphs & Geometry
465
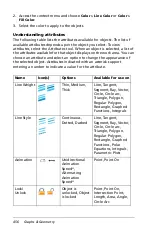
2. Navigate to the image you want to insert, select it, and then click
Open
.
The image is inserted as a background.
For more information, refer to the
Working with Images
chapter.
Adjusting variable values with a slider
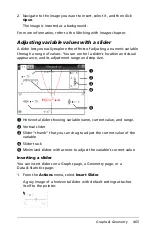
A slider lets you easily explore the effects of adjusting a numeric variable
through a range of values. You can control a slider's location and visual
appearance, and its adjustment range and step size.
À
Horizontal slider showing variable name, current value, and range.
Á
Vertical slider
Â
Slider “thumb” that you can drag to adjust the current value of the
variable
Ã
Slider track
Ä
Minimized sliders with arrows to adjust the variable’s current value
Inserting a slider
You can insert sliders on a Graphs page, a Geometry page, or a
Data & Statistics page.
1. From the
Actions
menu, select
Insert Slider
.
A gray image of a horizontal slider with default settings attaches
itself to the pointer.
Â
À
Á
Ã
Ä
Summary of Contents for TI-Nspire
Page 38: ...26 Setting up the TI Nspire Navigator Teacher Software ...
Page 46: ...34 Getting started with the TI Nspire Navigator Teacher Software ...
Page 84: ...72 Using the Content Workspace ...
Page 180: ...168 Capturing Screens ...
Page 256: ...244 Embedding documents in web pages ...
Page 336: ...324 Polling students ...
Page 374: ...362 Using the Review Workspace ...
Page 436: ...424 Calculator ...
Page 450: ...438 Using Variables ...
Page 602: ...590 Using Lists Spreadsheet ...
Page 676: ...664 Using Notes You can also change the sample size and restart the sampling ...
Page 684: ...672 Libraries ...
Page 714: ...702 Programming ...
Page 828: ...816 Data Collection and Analysis ...
Page 846: ...834 Regulatory Information ...
Page 848: ...836 ...

