Using Data & Statistics
591
Using Data & Statistics
The Data & Statistics application provides tools to:
•
Visualize sets of data in different types of plots.
•
Directly manipulate variables to explore and visualize data
relationships. Data changes in one application are dynamically
applied to all linked applications.
•
Explore central tendency and other statistical summary techniques.
•
Fit functions to data.
•
Create regression lines for scatter plots.
•
Graph hypothesis tests and results (z- and t-tests) based on summary
statistics definitions or data.
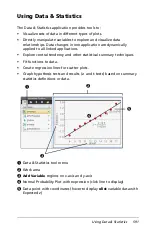
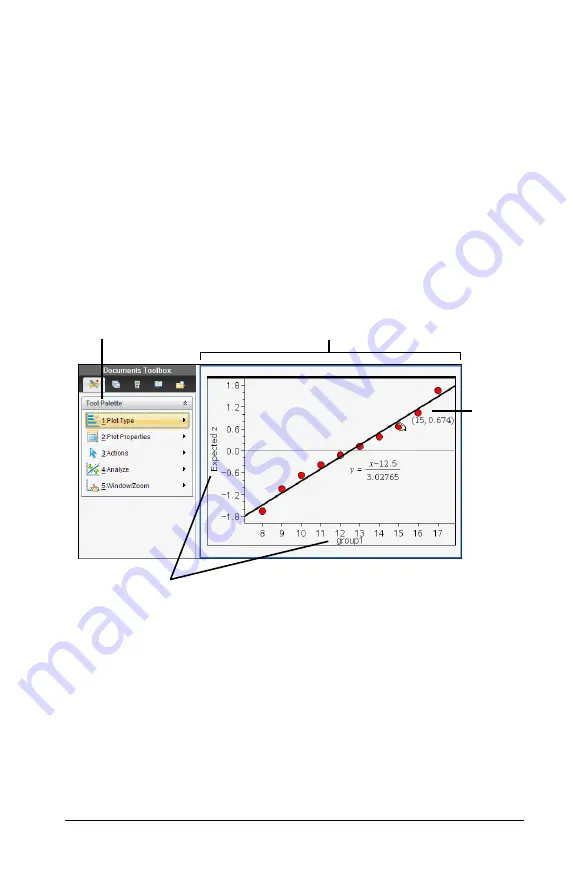
À
Data & Statistics tool menu
Á
Work area
Â
Add Variable
regions on x-axis and y-axis
Ã
Normal Probability Plot with expression (click line to display)
Ä
Data point with coordinates (hover to display
xlist
variable data with
Expected
z
)
À
Ã
Ä
Á
Â
Summary of Contents for TI-Nspire
Page 38: ...26 Setting up the TI Nspire Navigator Teacher Software ...
Page 46: ...34 Getting started with the TI Nspire Navigator Teacher Software ...
Page 84: ...72 Using the Content Workspace ...
Page 180: ...168 Capturing Screens ...
Page 256: ...244 Embedding documents in web pages ...
Page 336: ...324 Polling students ...
Page 374: ...362 Using the Review Workspace ...
Page 436: ...424 Calculator ...
Page 450: ...438 Using Variables ...
Page 602: ...590 Using Lists Spreadsheet ...
Page 676: ...664 Using Notes You can also change the sample size and restart the sampling ...
Page 684: ...672 Libraries ...
Page 714: ...702 Programming ...
Page 828: ...816 Data Collection and Analysis ...
Page 846: ...834 Regulatory Information ...
Page 848: ...836 ...

