Previews
110
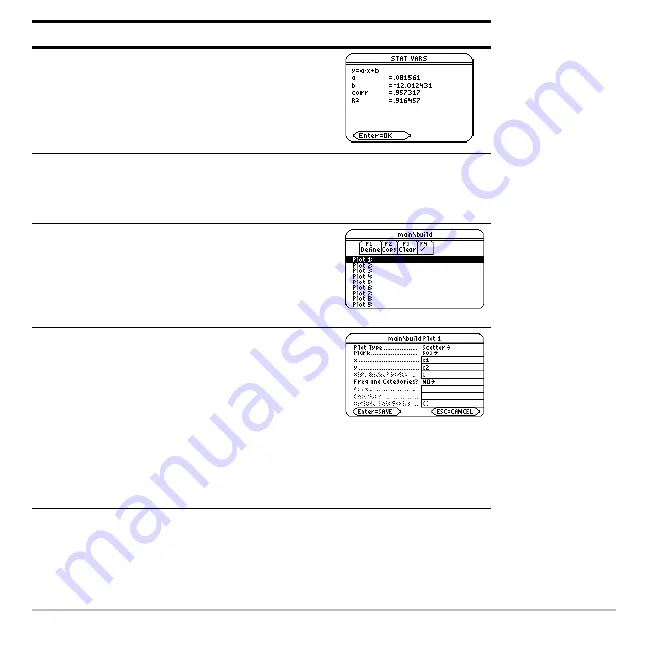
10. Perform the calculation to display the
LinReg regression equation.
This equation is stored in
y2(x)
.
Press
¸
11. Close the
STAT VARS
screen. The
Data/Matrix Editor
displays.
Press
¸
12. Display the Plot Setup screen.
Plot 1
is highlighted by default.
…
lets you clear highlighted Plot settings.
Press
„
13. Define
Plot 1
as:
Plot Type = Scatter
Mark = Box
x = C1
y = C2
Notice the similarities between this and
the
Calculate
dialog box.
@
,
B
1
D
B
1
D
C
j
1
D
j
C2
Steps and keystrokes
Display
Summary of Contents for Titanium TI-89
Page 9: ...Getting Started 6 TI 89 Titanium keys Ë Ì Í Ê ...
Page 34: ...Getting Started 31 2 or D 2 B u s i n e s s D B D B Press Result ...
Page 43: ...Getting Started 40 3 0 D B D D B D Press Result ...
Page 44: ...Getting Started 41 D 2 0 0 2 D B Scroll down to October and press Press Result ...
Page 58: ...Getting Started 55 Example Set split screen mode to TOP BOTTOM Press Result 3 B D ...
Page 70: ...Getting Started 67 ...
Page 175: ...Operating the Calculator 172 From the Keyboard ...
Page 456: ...Tables 453 ...
Page 527: ...Data Matrix Editor 524 ...

