Previews
112
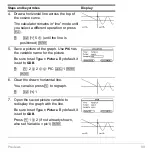
17. Use
ZoomData
to graph
Plot 1
and the
regression equations
y1(x)
and
y2(x)
.
ZoomData
examines the data for all
selected stat plots and adjusts the viewing
window to include all points.
Press
„
9
18. Return to the current session of the
Data/Matrix Editor
.
Press
2a
19. Enter a title for column 3. Define
column 3’s header as the values
predicted by the MedMed line.
To enter a title, the cursor must highlight
the title cell at the very top of the column.
†
lets you define a header from
anywhere in a column. When the cursor is
on a header cell, pressing
†
is not
required.
@
B
B
C
C
2
™
MED
j
¸
†
Y1
c
j
C1
d
¸
Steps and keystrokes
Display
Summary of Contents for Titanium TI-89
Page 9: ...Getting Started 6 TI 89 Titanium keys Ë Ì Í Ê ...
Page 34: ...Getting Started 31 2 or D 2 B u s i n e s s D B D B Press Result ...
Page 43: ...Getting Started 40 3 0 D B D D B D Press Result ...
Page 44: ...Getting Started 41 D 2 0 0 2 D B Scroll down to October and press Press Result ...
Page 58: ...Getting Started 55 Example Set split screen mode to TOP BOTTOM Press Result 3 B D ...
Page 70: ...Getting Started 67 ...
Page 175: ...Operating the Calculator 172 From the Keyboard ...
Page 456: ...Tables 453 ...
Page 527: ...Data Matrix Editor 524 ...


