Basic Function Graphing
299
From the Home Screen or a Program
You can also set a function’s style from the Home screen or a program. Refer to the
Style
command in the
Technical Reference
module.
Defining the Viewing Window
The viewing window represents the portion of the coordinate plane displayed on the
Graph screen. By setting Window variables, you can define the viewing window’s
boundaries and other attributes. Function graphs, parametric graphs, etc., have their
own independent set of Window variables.
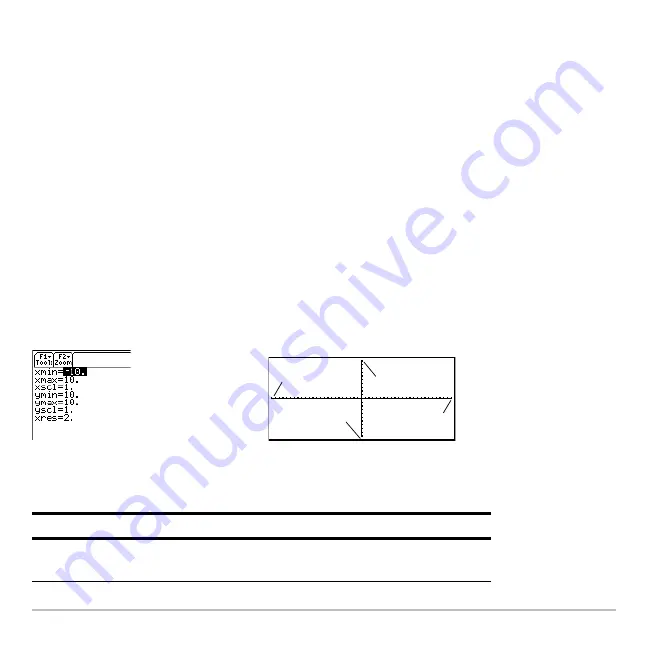
Displaying Window Variables in the Window Editor
Press
8 $
to display the Window Editor.
Window Variables
(shown in Window Editor)
Corresponding Viewing Window
(shown on Graph screen)
Variable
Description
xmin, xmax,
ymin, ymax
Boundaries of the viewing window.
xmin
ymax
ymin
xmax
xscl
yscl
Summary of Contents for Titanium TI-89
Page 9: ...Getting Started 6 TI 89 Titanium keys Ë Ì Í Ê ...
Page 34: ...Getting Started 31 2 or D 2 B u s i n e s s D B D B Press Result ...
Page 43: ...Getting Started 40 3 0 D B D D B D Press Result ...
Page 44: ...Getting Started 41 D 2 0 0 2 D B Scroll down to October and press Press Result ...
Page 58: ...Getting Started 55 Example Set split screen mode to TOP BOTTOM Press Result 3 B D ...
Page 70: ...Getting Started 67 ...
Page 175: ...Operating the Calculator 172 From the Keyboard ...
Page 456: ...Tables 453 ...
Page 527: ...Data Matrix Editor 524 ...


