Additional Graphing Topics
470
•
Suppose Graph 1 and Graph 2 are set for function graphing. Although both sides
show the same function list, you can select (
Ÿ
) different functions for graphing
Note:
If you make a change on the active Y= Editor (redefine a function, change a style,
etc.), that change is not reflected on the inactive side until you switch to it.
Using a Split Screen
For more complete information about split screens, refer to
Split Screens
.
•
To switch from one graph side to the other, press
2 a
(second function of
O
).
•
To display different applications:
-
Switch to the applicable graph side and display the application as you normally
would.
– or –
-
Use
3
to change
Split 1 App
and/or
Split 2 App
.
•
To exit two-graph mode:
•
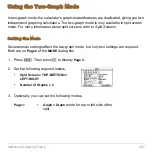
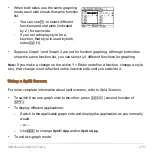
When both sides use the same graphing
mode, each side shows the same function
list.
-
You can use
†
to select different
functions and stat plots (indicated
by
Ÿ
) for each side.
-
If you set a display style for a
function, that style is used by both
sides.
2
ˆ
Summary of Contents for Titanium TI-89
Page 9: ...Getting Started 6 TI 89 Titanium keys Ë Ì Í Ê ...
Page 34: ...Getting Started 31 2 or D 2 B u s i n e s s D B D B Press Result ...
Page 43: ...Getting Started 40 3 0 D B D D B D Press Result ...
Page 44: ...Getting Started 41 D 2 0 0 2 D B Scroll down to October and press Press Result ...
Page 58: ...Getting Started 55 Example Set split screen mode to TOP BOTTOM Press Result 3 B D ...
Page 70: ...Getting Started 67 ...
Page 175: ...Operating the Calculator 172 From the Keyboard ...
Page 456: ...Tables 453 ...
Page 527: ...Data Matrix Editor 524 ...


