Appendix A: Functions and Instructions
871
ZoomFit
CATALOG
ZoomFit
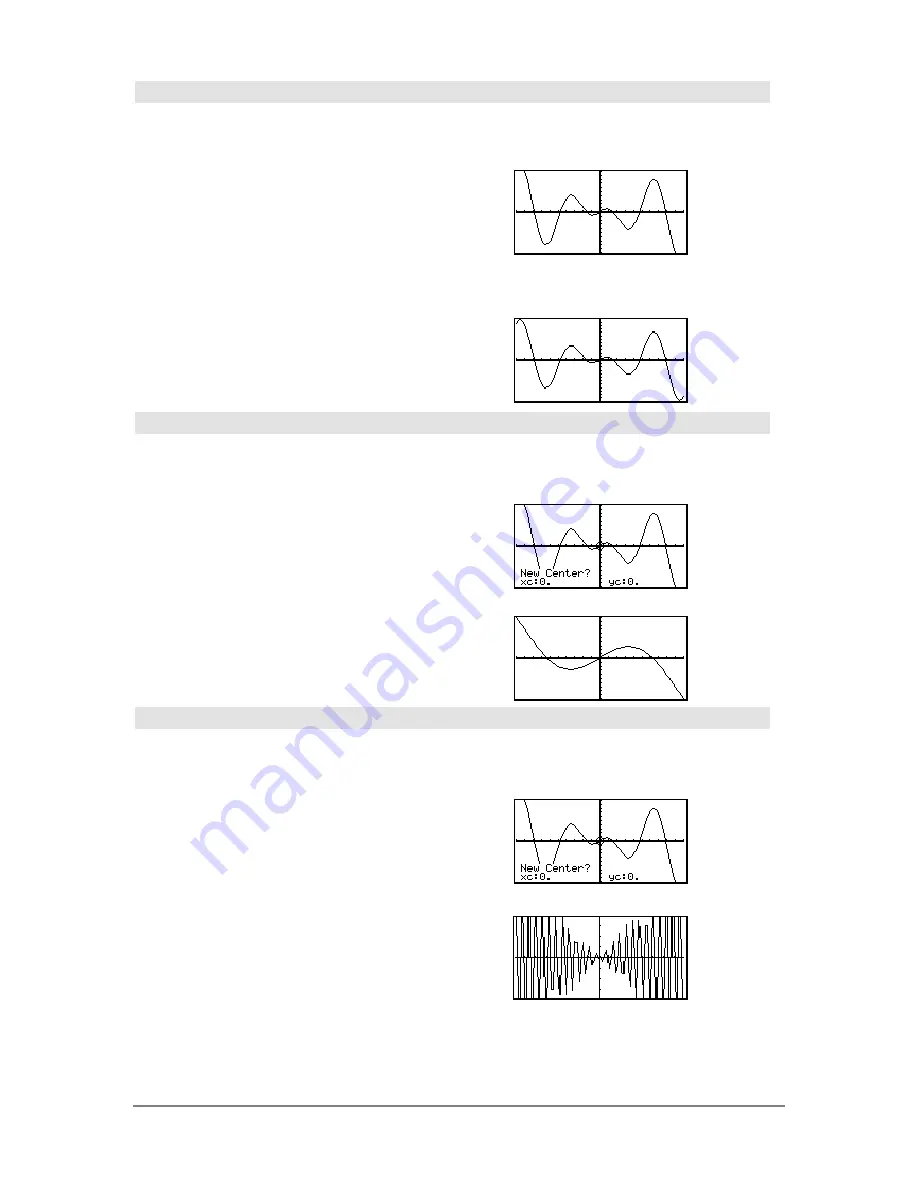
Displays the Graph screen, and calculates the
necessary window dimensions for the dependent
variables to view all the picture for the current
independent variable settings.
In function graphing mode:
1.25x
ù
cos(x)
!
y1(x)
¸
Done
ZoomStd
¸
@
"
H
¥
"
ZoomFit
¸
ZoomIn
CATALOG
ZoomIn
Displays the Graph screen, lets you set a center
point for a zoom in, and updates the viewing
window.
The magnitude of the zoom is dependent on the
Zoom
factors
xFact
and
yFact
. In 3D Graph mode,
the magnitude is dependent on
xFact
,
yFact
, and
zFact
.
In function graphing mode:
1.25x
ù
cos(x)
!
y1(x)
¸
Done
ZoomStd:ZoomIn
¸
¸
ZoomInt
CATALOG
ZoomInt
Displays the Graph screen, lets you set a center
point for the zoom, and adjusts the window settings
so that each pixel is an integer in all directions.
In function graphing mode:
1.25x
ù
cos(x)
!
y1(x)
¸
Done
ZoomStd:ZoomInt
¸
¸
Summary of Contents for Titanium TI-89
Page 9: ...Getting Started 6 TI 89 Titanium keys Ë Ì Í Ê ...
Page 34: ...Getting Started 31 2 or D 2 B u s i n e s s D B D B Press Result ...
Page 43: ...Getting Started 40 3 0 D B D D B D Press Result ...
Page 44: ...Getting Started 41 D 2 0 0 2 D B Scroll down to October and press Press Result ...
Page 58: ...Getting Started 55 Example Set split screen mode to TOP BOTTOM Press Result 3 B D ...
Page 70: ...Getting Started 67 ...
Page 175: ...Operating the Calculator 172 From the Keyboard ...
Page 456: ...Tables 453 ...
Page 527: ...Data Matrix Editor 524 ...


