Previews
91
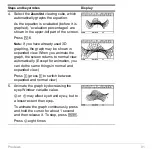
4. Select the
ZoomStd
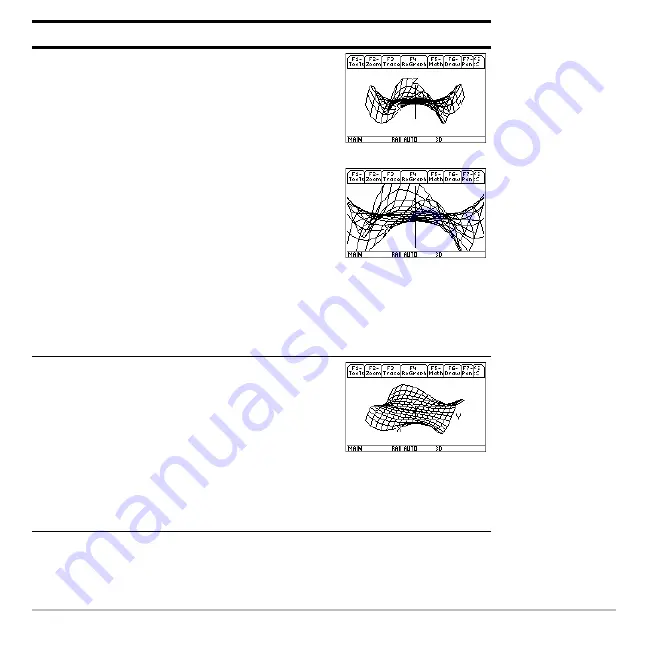
viewing cube, which
automatically graphs the equation.
As the equation is evaluated (before it is
graphed), “evaluation percentages” are
shown in the upper-left part of the screen.
Press
„
6
Note:
If you have already used 3D
graphing, the graph may be shown in
expanded view. When you animate the
graph, the screen returns to normal view
automatically. (Except for animation, you
can do the same things in normal and
expanded view.)
Press
p
(press
p
to switch between
expanded and normal view)
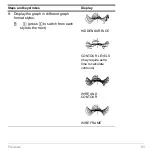
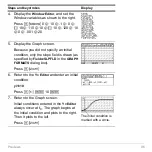
5. Animate the graph by decreasing the
eye
f
Window variable value.
D
or
C
may affect eye
q
and eye
ψ
, but to
a lesser extent than eye
f
.
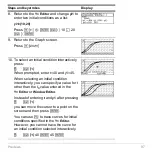
To animate the graph continuously, press
and hold the cursor for about 1 second
and then release it. To stop, press
¸
.
Press
D
eight times
Steps and keystrokes
Display
Summary of Contents for Titanium TI-89
Page 9: ...Getting Started 6 TI 89 Titanium keys Ë Ì Í Ê ...
Page 34: ...Getting Started 31 2 or D 2 B u s i n e s s D B D B Press Result ...
Page 43: ...Getting Started 40 3 0 D B D D B D Press Result ...
Page 44: ...Getting Started 41 D 2 0 0 2 D B Scroll down to October and press Press Result ...
Page 58: ...Getting Started 55 Example Set split screen mode to TOP BOTTOM Press Result 3 B D ...
Page 70: ...Getting Started 67 ...
Page 175: ...Operating the Calculator 172 From the Keyboard ...
Page 456: ...Tables 453 ...
Page 527: ...Data Matrix Editor 524 ...


