


5.5.1
Input Parameters
5.5.2
Results
5.5.3
Time Domain Statistics
www.ti.com
User Interface
The sampling rate is entered in the ADC Sampling Rate text box, also called the Sampling Frequency FS.
If this number was entered in the Single FFT test then it is carried over to this test.
The expected input frequency is entered in the ADC Input Frequency input box, although the
auto-calculation of coherent frequency does not occur in this test. If auto-calculation of coherent frequency
is required, it must be entered in the Single Tone FFT test and then the Time Domain test must be
selected. When done in this order, the coherent input frequency is carried over to the Time Domain test.
The FFT record length can be set in the FFT Record Length (NS) input text box. The TSW1200EVM
supports FFT record lengths of as much as 65536 samples, or as little as 4096 samples.
The Overlay Unwrap Waveform check box allows a calculated normalized waveform to be overlaid over
the sample data. If the sample and input frequencies are coherent, the sampled data is normalized into a
calculated representation of a single period of a sine wave. Errors in the sampled data for any reason
become immediately apparent as spikes on the unwrapped waveform.
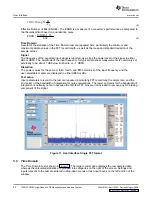
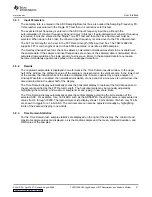
The captured sample data is displayed in two formats in the Time Domain results window. In the upper
half of the window, the arithmetic value of the sample is represented on the vertical scale. In the lower half
of the window the individual bits of the data are displayed as if it were captured by a logic analyzer. If
Unwrap Waveform is enabled, the normalized calculation of one period of a sine wave is overlaid over the
time domain data in the upper half of the display.
The Time Domain display automatically scales the horizontal display to represent the full data capture to
the amount specified by the FFT Record Length. The horizontal scale may be manually adjusted by
highlighting the minimum and maximum sample limits and typing in new scale limits.
The Time Domain display automatically scales the vertical display according the bit resolution of the
selected ADC. For example, for a 14-bit ADC such as the ADS62P45, the vertical scale is represented as
values from 0 through 16000. The logic-analyzer-style display shows 16 bits of data, of which only 14 bits
are shown to toggle for a 14-bit ADC. The vertical scale can also be adjusted manually by highlighting
limits of the scale and typing in new limits.
For the Time Domain test, sample statistics are displayed on the right of the display. The minimum and
maximum sample values are displayed, as is the median sample and the mean, standard deviation, and
RMS value of the samples.
SLAU212A – April 2007 – Revised August 2008
TSW1200EVM: High-Speed LVDS Deserializer and Analysis System
21


