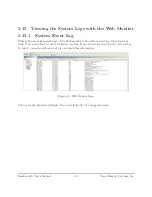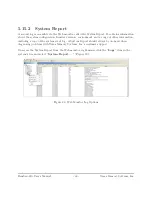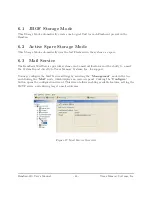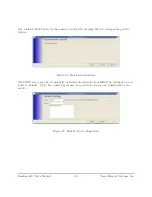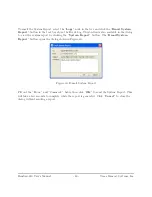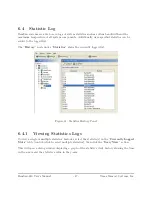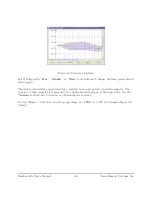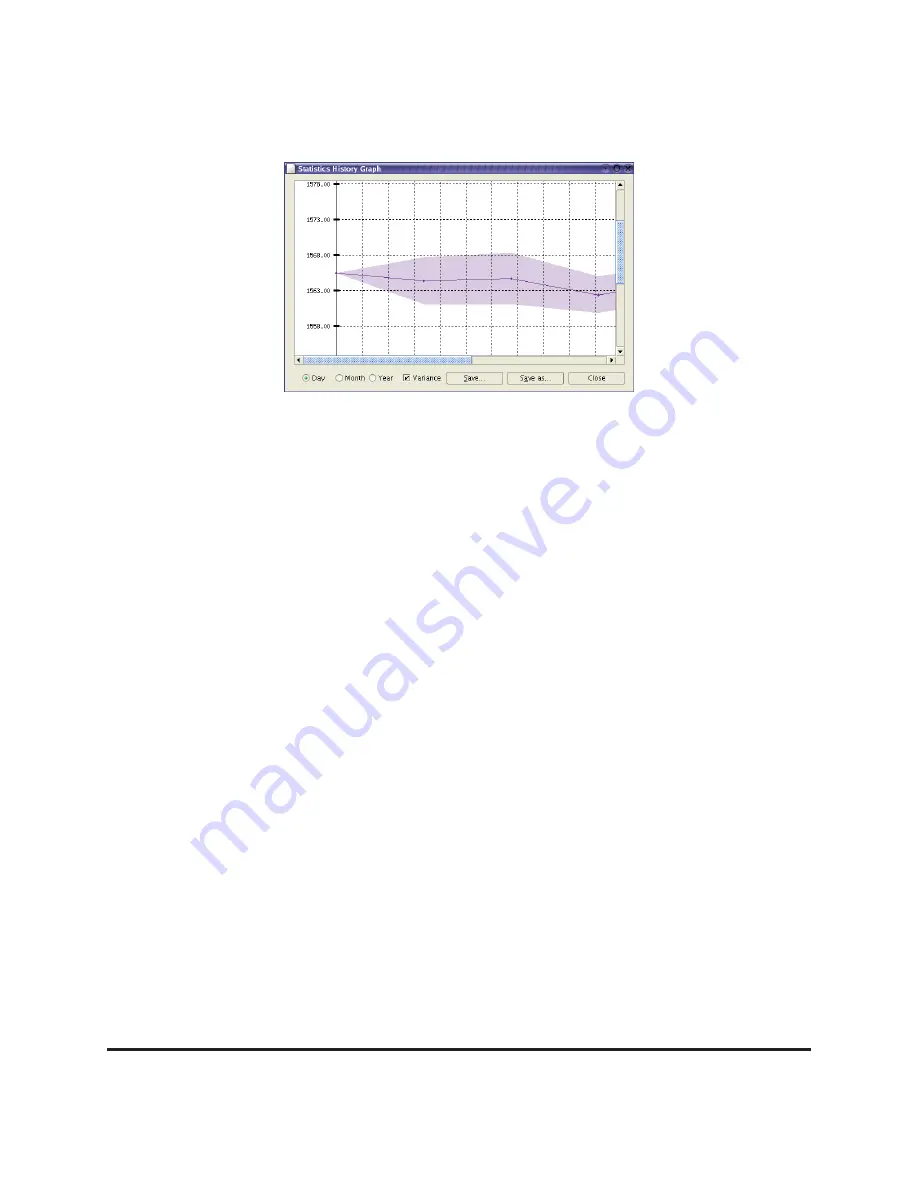
Figure 32: Viewing a Statistic
Select between the “
Day
,” “
Month
,” or “
Year
” radio buttons to change the time period shown
in the graph.
The darker-colored line graph drawn for a statistic is an average line of periodic samples. The
variance of these samples is represented by a lighter-shaded polygon of the same color. Use the
“
Variance
” check-box to turn on or off drawing the variance.
Use the “
Save...
” button to save the graph image as a JPEG or a CSV file (Comma-Separated
Values).
RamSan-810 User’s Manual
- 48 -
Texas Memory Systems, Inc.

