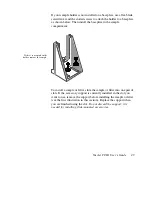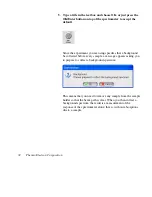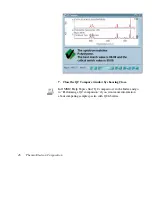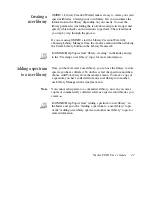
When you use a tool, the readout above the palette may display
information for the tool operation, such as the X and Y values of the
pointer location or the limits of the selected spectral region. Here is
an example of X and Y values displayed in the readout when the
selection tool is selected and the pointer is within the spectral
display:
Follow these steps to label a peak in the polystyrene spectrum:
1. Select the annotation tool by clicking it.
The annotation tool lets you label peaks with their frequency
locations (X values) or other information.
When the annotation tool is selected and you move the pointer
into the spectral display, the pointer looks like this:
You can label a peak by clicking above it with the annotation
tool. This displays the label text above the peak with a line
connecting the label to the peak. The text is selected so that you
can immediately edit it. When you press Enter, the label appears
in its final form.
Nicolet FT-IR User’s Guide 41


