© 2011 Thorlabs
33
Operating the Beam Profiler
3.3.2.1
2D Projection
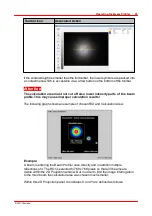
The 2D Projection graph shows the image from the Beam Profiler indicating the
power intensity distribution within the selected Region of Interest (ROI).
This window can be opened and closed via the menu item "2D Projection" in the
window menu or via the toggle button
in the toolbar. The window can also be
closed via the X button in the upper right corner of the child window.
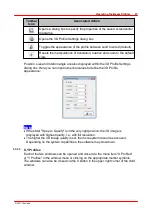
On the left side of the 2D Projection window a toolbar is located with the following
toggle buttons:
Toolbar Icon
Associated Action
Save diagram or
data
Opens a dialog box to specify the properties of the saved
screenshots / diagrams.
Scale
Show or hides the x and y scale
Color
Changes the color of the image from grayscale to color (see
)
Peak
Marks the Peak Position using a green cross
Centroid
Marks the Beam Centroid using a blue cross within a blue
circle; resets the centroid indicators
Ellipse
Displays the approximated Beam Ellipse in yellow color.
The ellipse is drawn corresponding to fitted or unfitted
numerical data. See
to enable/
disable the ellipse fit.
The reference position influences the calculation results;
peak and centroid positions refer to the reference position.
The reference position can be either the center of the
sensor, the center of the region of interest, the peak
position, the centroid position or a user defined position
which can be set in reference position edit mode.
62
59
Summary of Contents for BC106-UV
Page 1: ...2011 Operation Manual Thorlabs Beam Beam Analyzing Software BC106 VIS BC106 UV ...
Page 2: ...Version Date 4 0 11 04 2011 2011Thorlabs 2011Thorlabs ...
Page 76: ... 2011Thorlabs 74 Thorlabs Beam 4 0 Example ...
Page 157: ... 2011Thorlabs 155 Appendix 7 4 4 Drawings 7 4 4 1 BC106 UV ...
Page 158: ... 2011Thorlabs 156 Thorlabs Beam 4 0 7 4 4 2 BC106 VIS ...
Page 159: ... 2011Thorlabs 157 Appendix 7 4 4 3 BC1M2 Mounting Adapter ...
Page 160: ... 2011Thorlabs 158 Thorlabs Beam 4 0 7 4 4 4 Translation Stage VT 80 ...
Page 167: ......


