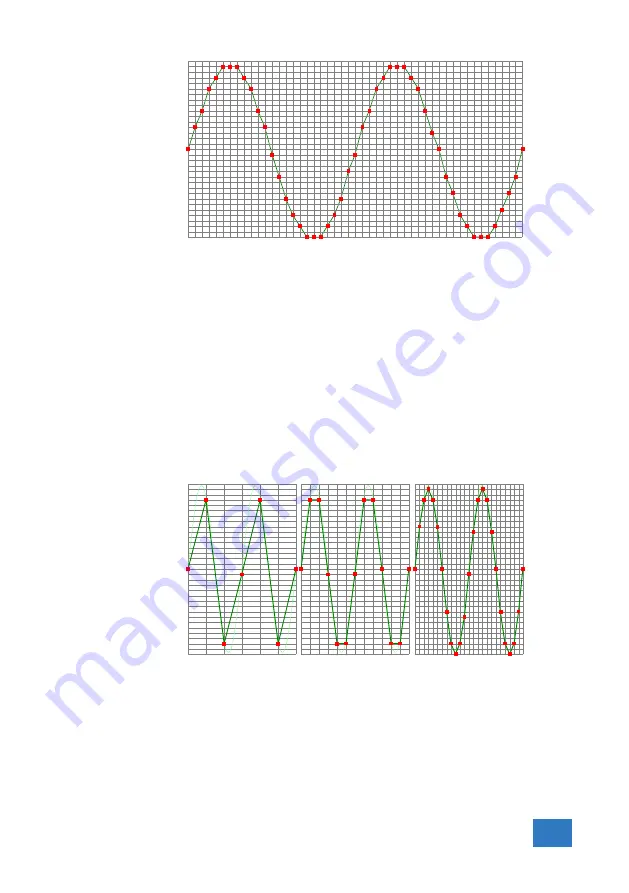
Figure 3.4: ”connecting” the samples
3.3
Sample frequency
The rate at which the samples are taken is called the
sampling
frequency
, the number of samples per second. A higher sampling
frequency corresponds to a shorter interval between the samples.
As is visible in figure
, with a higher sampling frequency, the
original signal can be reconstructed much better from the measured
samples.
Figure 3.5: The effect of the sampling frequency
The sampling frequency must be higher than 2 times the high-
est frequency in the input signal. This is called the
Nyquist fre-
quency
. Theoretically it is possible to reconstruct the input signal
with more than 2 samples per period. In practice, 10 to 20 sam-
Introduction
9
Summary of Contents for Handyscope TP450
Page 1: ...Handyscope TP450 User manual TiePie engineering ...
Page 4: ...7 11 Measure lead 27 7 12 Package contents 28 II ...
Page 6: ...2 Chapter 1 ...
Page 18: ...14 Chapter 3 ...
Page 24: ...20 Chapter 4 ...
Page 28: ...24 Chapter 6 ...


