Zeus200
User Manual
V 1.0.8
– 12/10/2020
Page 7 of 16
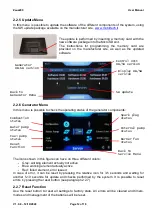
2.1.1 Solar panel management
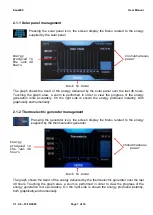
Pressing the solar panel icon, the screen display the Menu related to the energy
supplied by the solar panel
The graph shows the trend of the energy delivered by the solar panel over the last 48 hours.
Touching the graph area, a zoom is performed in order to view the progress of the energy
generation more accurately. On the right side is shown the energy produced instantly, both
graphically and numerically.
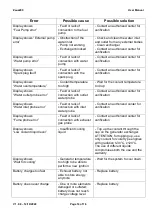
2.1.2 Thermoelectric generator management
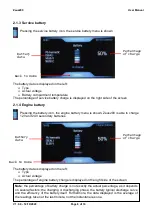
Pressing the generator icon, the screen display the Menu related to the energy
supplied by the thermoelectric generator
The graph shows the trend of the energy delivered by the thermoelectric generator over the last
48 hours. Touching the graph area, a zoom is performed in order to view the progress of the
energy generation more accurately. On the right side is shown the energy produced instantly,
both graphically and numerically
Energy
produced in
the last 48
hours
Instantaneous
power
Instantaneous
power
Energy
produced in
the last 48
hours
Back to Home
Back to Home


