CA-200F Corneal Analyser - Rev. 7 16/01/2012
40
Considering that dynamic pupillometry consists of acquisition of a sequence of images as the light conditions
change from scotopic to photopic and back to scotopic and that the scotopic (red band) and photopic (green
band) acquisition times c
an be set in “Settings” in the “Acquisition settings” section, there is also a legend
that explains the meaning of the colors in the graph:
-
Red for scotopic acquisition where the white LEDs are off;
-
Green for the pupil contraction phase following the change from LEDs off to LEDs on;
-
Blue for the pupil dilation phase following the change from LEDs on to LEDs off.
The decentralization and latency graphs are viewable only if a dynamic pupillometry has been acquired.
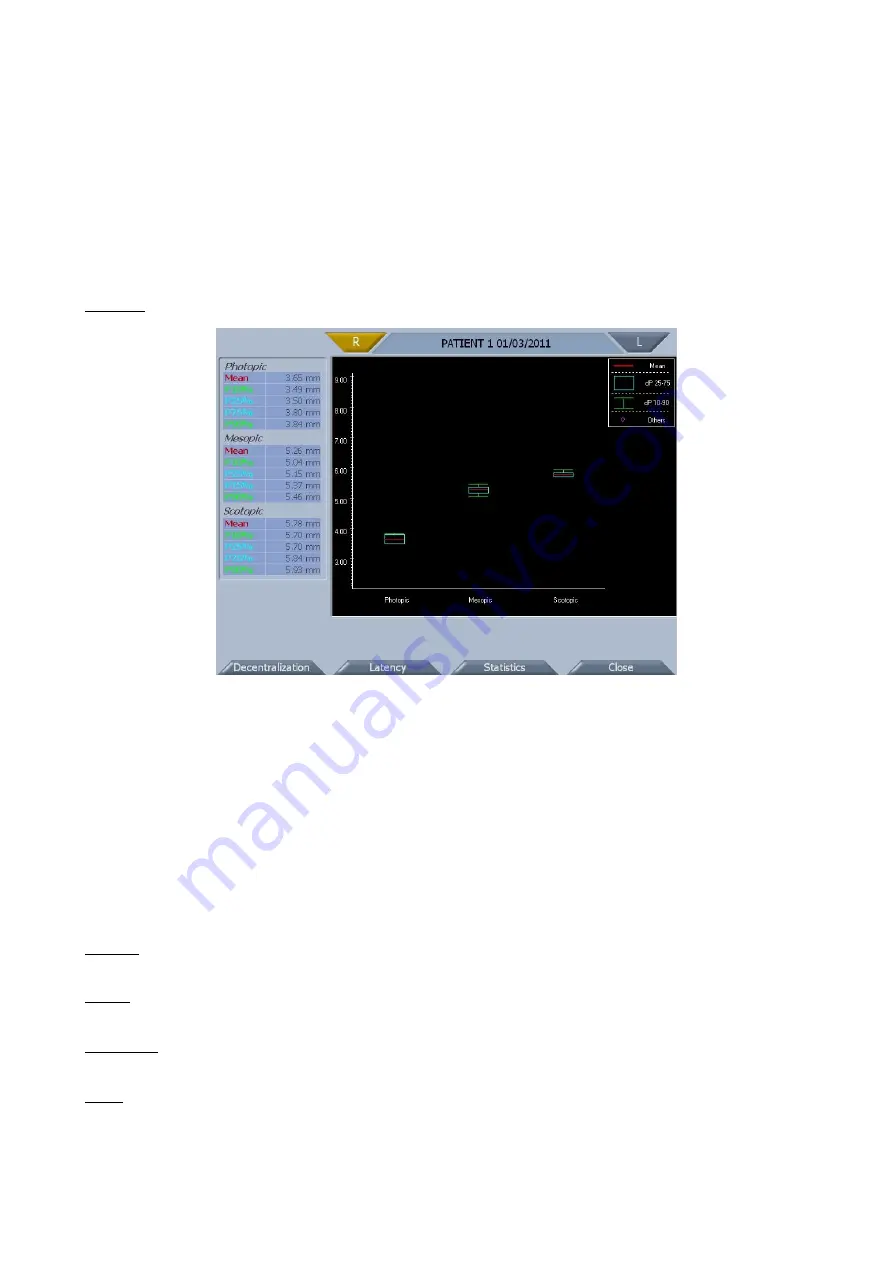
Statistics
fig. 1-46
The graph represents the statistical percentile value of the sample for each acquisition in controlled light
conditions.
As indicated in the legend on the right-hand side and the values shown on the left, the red line represents
the mean value of the sample, the blue square the interval of values between the percentile at 25% and at
75%, the green line the interval of values between the percentile at 10% and at 90% and the pink circle the
values outside this interval.
The statistics graph is viewable only if images of the pupil have been acquired in photopic, mesopic or
scotopic conditions.
Functions
Settings
Opens the pupillometry settings.
Report
Saves the report as a PDF file to a USB unit or prints it on a connected USB printer.
Acquisition
Returns to the acquisition window.
Close
Tapping on the
“Close”
button, the system:
-
returns to the topographic map environment if you have also acquired topographies in the same
session;
-
returns to the acquisition environment in every other cases.


