6 F 2 T 0 1 7 2
In fact, the cold curve is simply a special case of the hot curve where prior load current I
P
= 0, catering
for the situation where a cold system is switched on to an immediate overload.
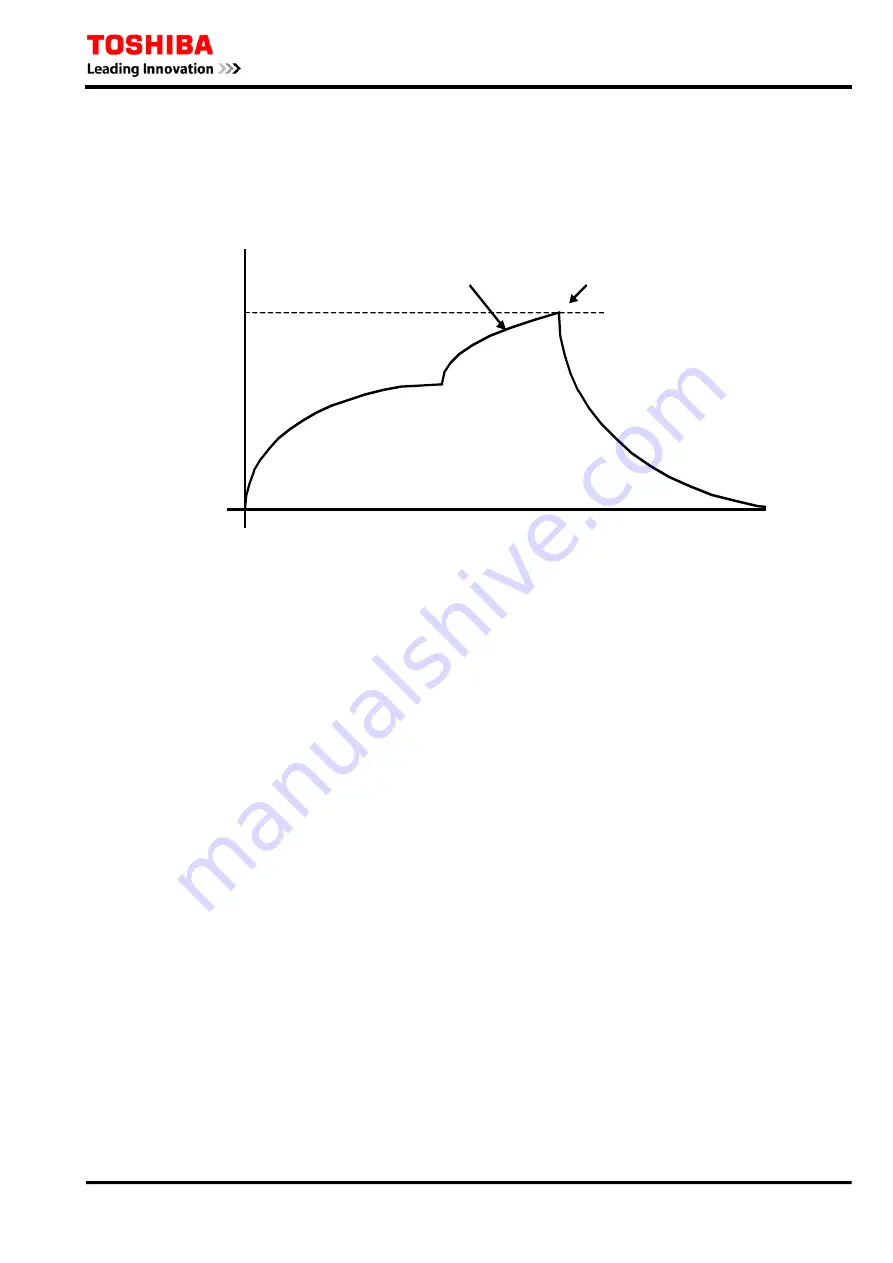
Figure A-3 shows a typical thermal profile for a system which initially carries normal load current, and
is then subjected to an overload condition until a trip results, before finally cooling to ambient
temperature.
θ
(
%
)
t (s)
100%
Normal Load
Current Condition
Cooling Curve
Overload Current
Condition
Trip at 100%
Figure A-3
183
Summary of Contents for GRE110
Page 183: ...6 F 2 T 0 1 7 2 Appendix B Signal List 184 ...
Page 191: ...6 F 2 T 0 1 7 2 Appendix C Event Record Items 192 ...
Page 196: ...6 F 2 T 0 1 7 2 Appendix D Binary Output Default Setting List 197 ...
Page 199: ...6 F 2 T 0 1 7 2 Appendix E Relay Menu Tree 200 ...
Page 210: ...6 F 2 T 0 1 7 2 Appendix F Case Outline 211 ...
Page 211: ...6 F 2 T 0 1 7 2 Case Outline for model 400 401 420 421 820 and 821 212 ...
Page 212: ...6 F 2 T 0 1 7 2 Case Outline for model 402 and 422 213 ...
Page 213: ...6 F 2 T 0 1 7 2 Appendix G Typical External Connection 214 ...
Page 245: ...6 F 2 T 0 1 7 2 Appendix J Return Repair Form 246 ...
Page 249: ...6 F 2 T 0 1 7 2 Customer Name Company Name Address Telephone No Facsimile No Signature 250 ...
Page 250: ...6 F 2 T 0 1 7 2 Appendix K Technical Data 251 ...
Page 256: ...6 F 2 T 0 1 7 2 Appendix L Symbols Used in Scheme Logic 257 ...
Page 259: ...6 F 2 T 0 1 7 2 Appendix M Modbus Interoperability 260 ...
Page 289: ...6 F 2 T 0 1 7 2 Appendix N IEC60870 5 103 Interoperability 290 ...
Page 296: ...6 F 2 T 0 1 7 2 Appendix O PLC Default setting 297 ...
Page 298: ...6 F 2 T 0 1 7 2 Appendix P Inverse Time Characteristics 299 ...
Page 304: ...6 F 2 T 0 1 7 2 Appendix Q IEC61850 Interoperability 305 ...


