17 |
7.4
CurveX4 Logger operation measurement
ºC
+8
+6
+4
+2
0
-2
-4
-6
-8
-200ºC
1200ºC
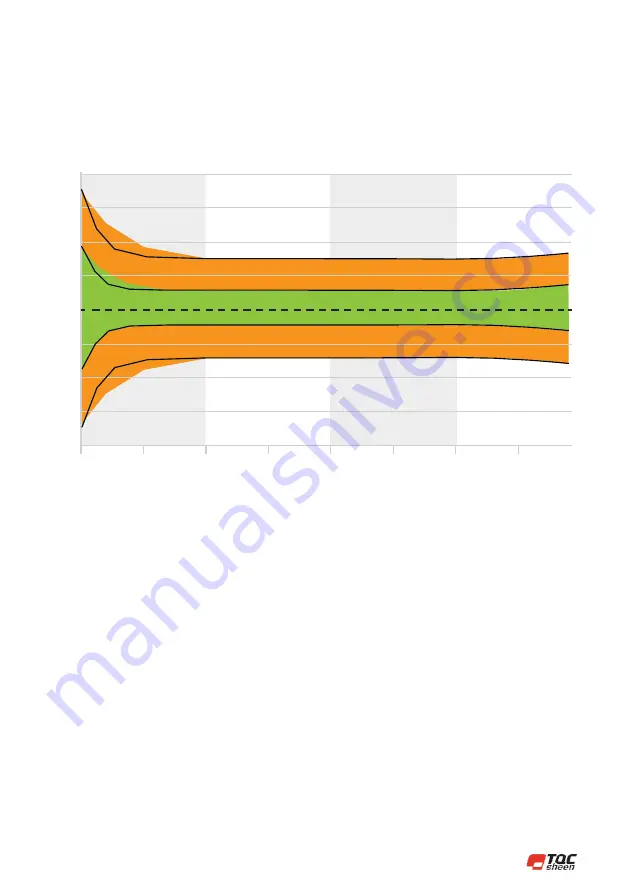
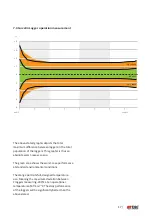
The above-stated graphic depicts the total
maximum difference between loggers in the total
population of the loggers. This graphic is thus an
absolute worst-case scenario.
The green zone shows the worst-case performance
at standard environmental conditions.
The orange part is its full-designed temperature
use. Meaning the maximum deviation between
2 loggers measuring -200°C at an operational
temperature of 65°C is 7°C. The daily performance
of the loggers will be significantly better than the
above stated.
-10 - | +65ºC
25 ± 5ºC
-10 - | +65ºC


