TruVision 6MP and 12MP 360° Camera Configuration Manual
73
Intersection analysis statistics
When enabled, the intersection analysis function lets you view and download the
intersection analysis data from the Application tab. It displays the direction of flow of
people in the configured area. You can display the data in different charts.
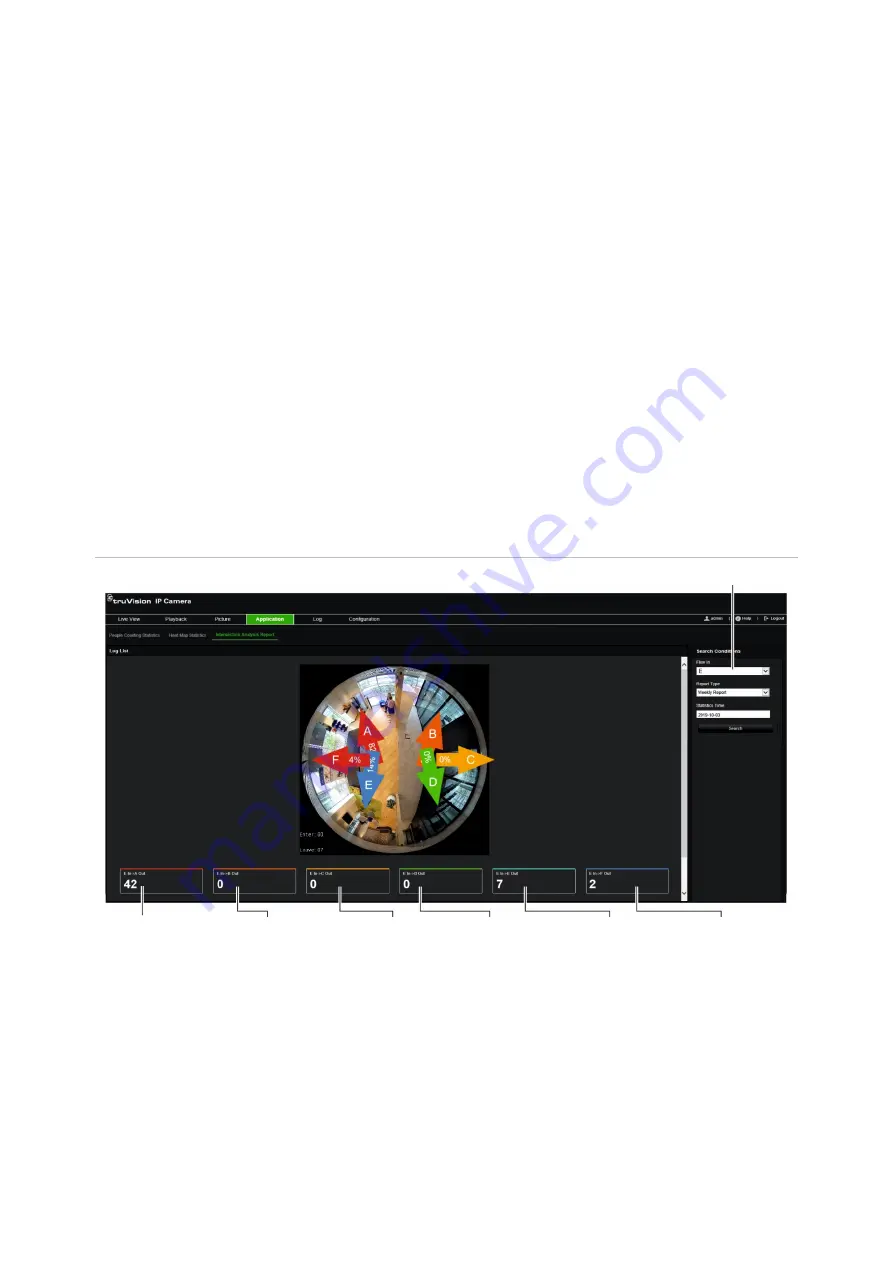
An example of the results of an analysis is shown in Figure 18 below. See Figure 14 on
page 68 for the monitored area set up for this example. The results of the analysis are
listed below the 360°view, the colors of the boxes matching that of the arrows.
The arrows display the percentage of people flowing in the direction of the arrow. The
boxes display the number of people detected flowing into the selected
flow in
arrow
point and then flowing out from each of the other arrow points. In the example below,
the
Flow in
is E and the results show the flow of people from E to each of the other five
arrows. The
flow out
arrows are always shown in alphabetical order.
You can set up the analysis on how you want to be notified of these results, such as by
email for example. See the section “Intersection analysis” on page 67 for further
information.
Note
: The direction of the requested flow in arrow head does not indicate the direction
of the flow in.
Figure 18: Example of the results of an intersection analysis
Flow in selection (“E” is used in this example)
Flow in E to
Flow out A
Flow in E to
Flow out B
Flow in E to
Flow out C
Flow in E to
Flow out D
Flow in E to
Flow out E
Flow in E to
Flow out F
Before you start:
You have to configure the
Intersection Analysis
setting before you can view and
download the intersection analysis data from the application tab. Refer to the section
“Intersection analysis” on page 67 for detailed information.


