3-28
AeroTrak
®
Handheld Airborne Particle Counter
Data Tab
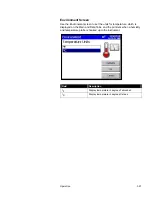
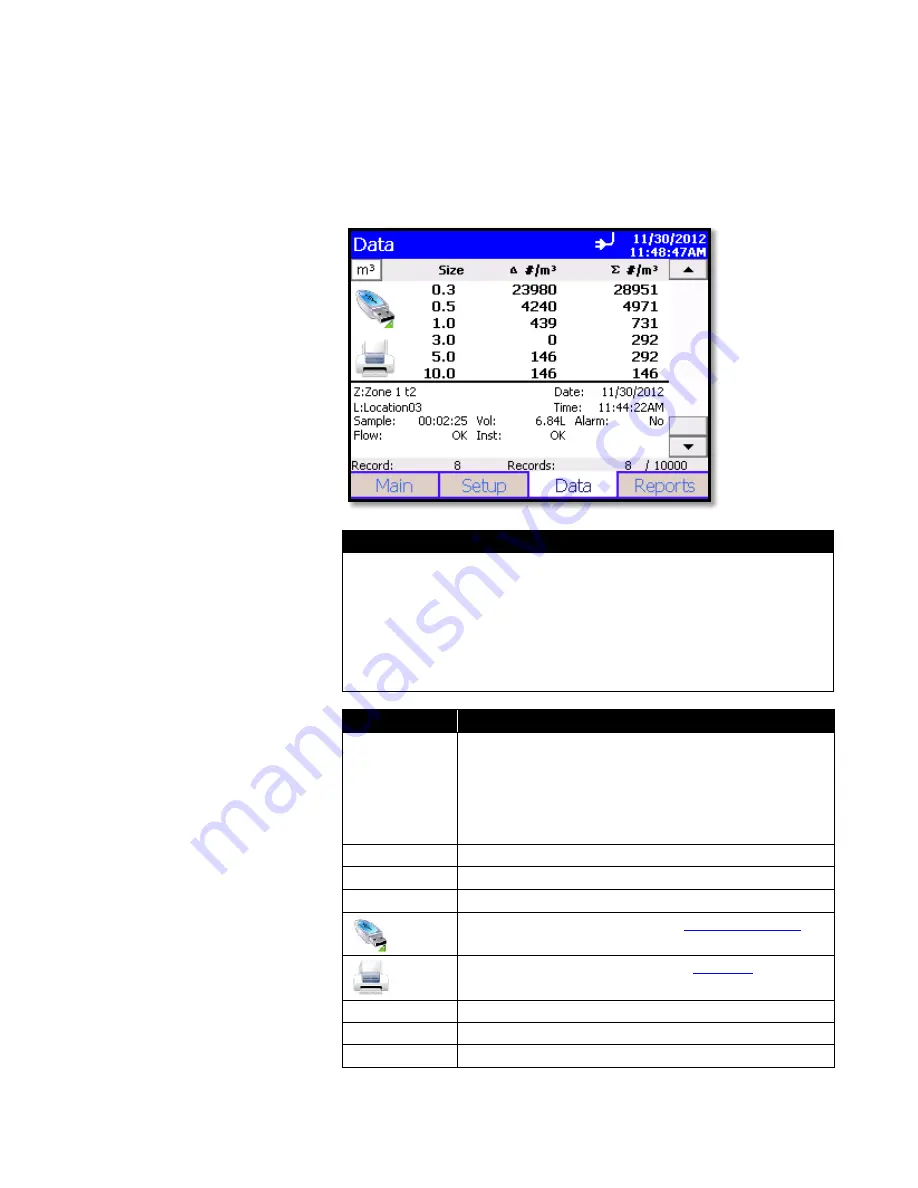
Use the Data tab to preview data that has been collected. To scroll
though the records, use the elevator (slide) on the right. The record
number is displayed at the bottom of the tab. As each record displays, its
data and relevant parameters are displayed.
N o t e
Counts displayed on the data tab concentration may have slight
rounding errors when comparing all channels to values with selected
channels enabled. The method for calculating concentration is to sum
the raw counts for each location, calculate concentration from sample
volume and then round. This may result in slight rounding errors when
comparing counts with all channels enabled versus concentrations with
selected channels enabled. The methodology utilized is covered in ISO
14644-1 Annex D.
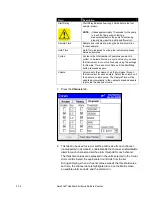
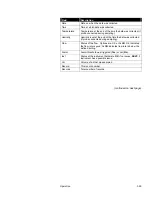
Field
Description
#, ft
3
, m
3
, µg
Button used to change between counts and concentration
displays:
# = number
ft
3
= particles per cubic foot
m
3
= particles per cubic meter
µg = micrograms per cubic meter (mass concentration)
Size
Channel size.
Differential mode.
Cumulative mode.
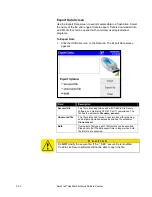
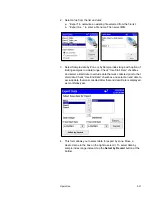
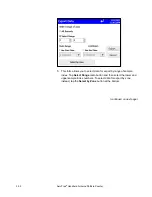
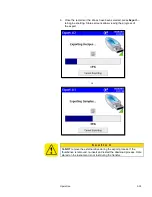
Export the data to a flash drive. See
below.
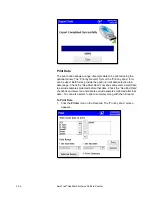
Print data to the optional printer. See
Zone (Z)
Zone where the data was collected.
Location (L)
Location where the data was collected.
Sample
Duration of the sampling period.
Summary of Contents for AEROTRAK 9306
Page 2: ......
Page 62: ...5 2 AeroTrak Handheld Airborne Particle Counter This page intentionally left blank ...
Page 68: ...7 4 AeroTrak Handheld Airborne Particle Counter This page intentionally left blank ...
Page 72: ...A 4 AeroTrak Handheld Airborne Particle Counter This page intentionally left blank ...
Page 76: ......

