OPERATOR’S MANUAL
172 / TASK CONTROLLER
ISO
6
Version 4 UL 2_3 Manual
6011258 Rev C
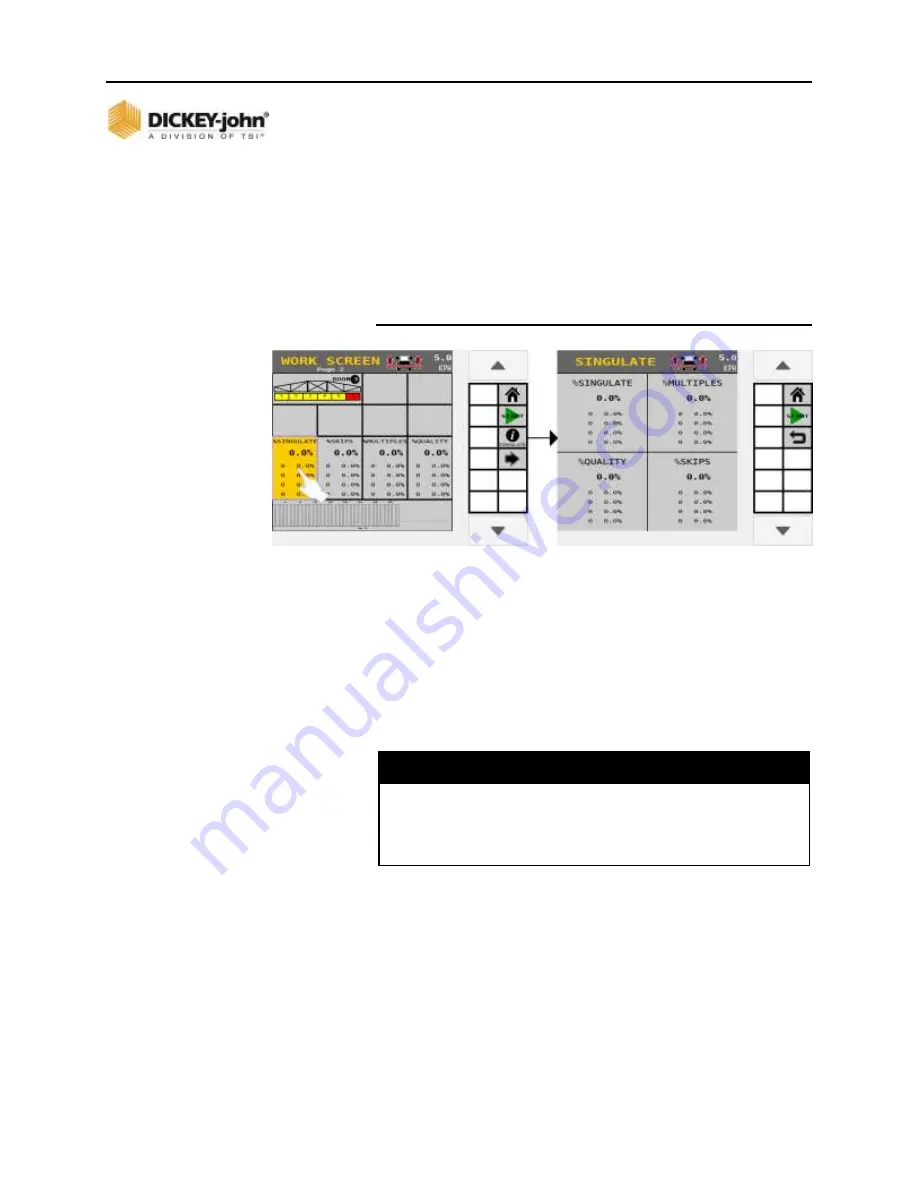
% QUALITY
Displays the average percent spacing of quality across the
planter rows in the % Quality column.
% SKIPS
Displays the average percent of seeding skips across the planter
in the % Skips column.
Figure 134
Seed Singulation and Spacing Quality
QUALITY
Quality bar graph information screen displays complete data
on one screen for a specific row. Highlight the row input to
change to another row or press the Next Row button to view
the next row.
Data specifics for a row include Singulation %, Quality %,
Skips %, and Multiples %.
IMPORTANT
Singulation, Quality, Skips, and Multiple % is only
calculated for the rows connected to a WSMB2 module or
an ISO
6
. Any rows connected to a WSMB module will NOT
be included in this calculation.


