Easi-Walker User Guide
6
Switching between Activity and Pedometer Views
•
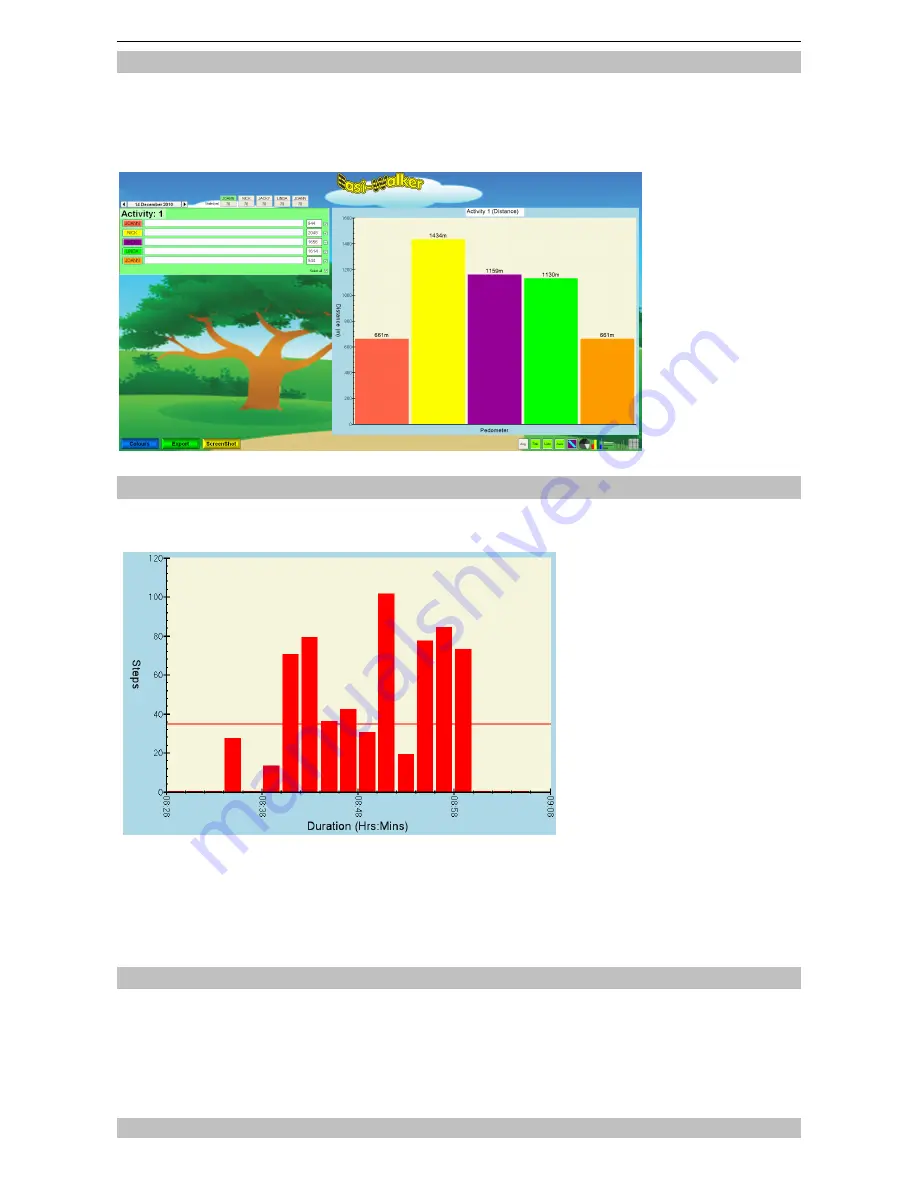
If you want to compare the performance of all the pedometers for the same activity, click on
the activity number on the left. If you click on “ACT 1” for instance, you would see the data
for all pedometers on Activity 1
•
In Activity view the colours shown on the chart will match the pedometer colour
Using the Time Chart function
•
When you are viewing the 2-minute data using the Time Chart function, it will show all the
activities for the selected pedometer, with each activity starting at 00:00. Each Activity will
be in a different colour.
•
If you select any activity, it
will show ALL activities for
each pedometer attached.
Each pedometer will be in
a different colour, with the
breaks between activities
shown as diamonds.
•
Because the activity
number can change
within a 2 minute period, it
is possible that there can
be small discrepancies
between the step counts
shown in the different
views.
•
To zoom in to a part of the chart, hold down the left click button then drag over the area you
want to zoom in on, the area then becomes highlighted red. When you have the area
covered in red that you would like to zoom in on, let go of the left click and that area will
now be shown in the graph area.
•
In this chart type, if the icon is clicked again it shows a cumulative graph of the total number
of steps for that day.
Naming the Activities
•
The name for an activity e.g Football, can be typed into the white box next to the activity
number. The activity labelled football is then saved only for that specific activity for that
pedometer and on that day
•
To make it quicker to add activity names, the names that have been used before are
entered into an auto-complete list and will pop-up as you start typing them. Select the name
you want and press the <Enter> key to accept
Summary of Contents for Easi-Walker
Page 1: ......


