background image


Umwelt-Geräte-Technik GmbH

  |  Eberswalder Str. 58  |  D-15374 Müncheberg  |  Tel.: +49 (0) 33 43 2 - 89 575 |  

www.ugt-online.de

          Seite 15 von 17 


b)


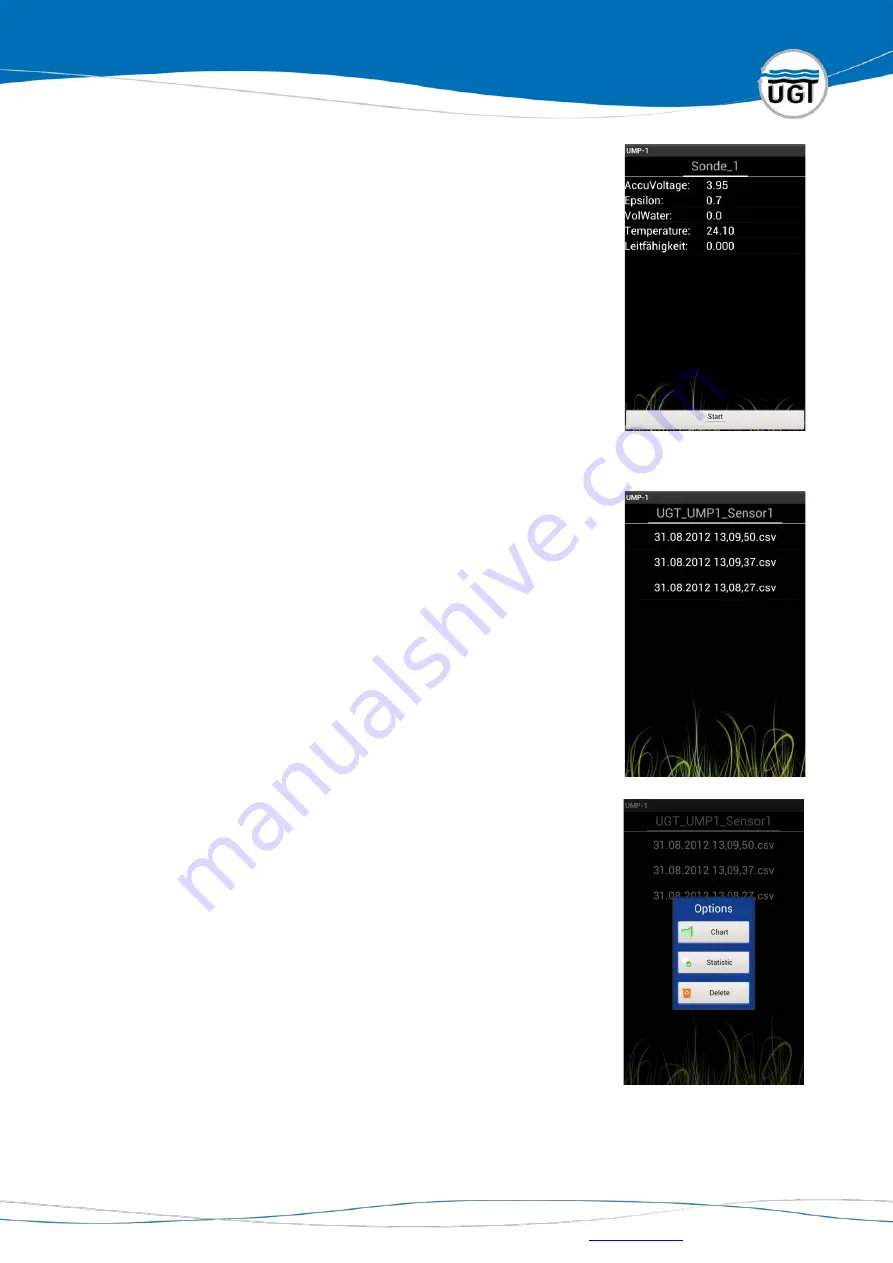
Text view 

In the text view, all 5 measurements for a probe are depicted at 

the same time, and the last measurement can always be seen.  

Each probe has its own screen in the display element.  You can 

switch between the individual screens by moving or sweeping a 

finger from one side of the display to the other.  If you move 

your finger from right to left, you get to the next screen on the 

right (in relation to the current screen).  If you move from left to 

right, the left-hand preceding screen opens.  The name of the 

probe for which the measurements are displayed can be seen 

on the top edge of the screen. 
 

Files 

File management under “Files” is only possible if at least one 

record has been made.  The file menu is used to manage the 

recorded measurements.  The recorded files are stored in the 

external memory of the device so that the files can be 

downloaded (e.g. to a PC).  The first time recording takes place, 

the folder “UMP1” is created in the file system (/mnt/sdcard).  A 

folder with the corresponding name will be created in this for 

each probe.  All recorded measurements for a probe are stored 

in its folder.  The measurements are stored in text form as CSV 

file so that they can be further edited in the spreadsheet 

program (e.g. Excel).    For clear assignment, the file name 

includes the time at which the measurement started.  By 

brushing your finger from left to right or vice versa over the 

display, you can switch between folders or the various flags of 

the display element.  The name of the folder (identical to the 

name of the device) for which the files are just being displayed 

can be found on the top edge of the screen.  All files are listed 

below this.  
Tap on a file to open a dialogue with possible options:  


 Graph: apply and display measurements in the chart 


 Statistics: text advance analysis of measurements 


 Delete: delete file 


Summary of Contents for UMP-1

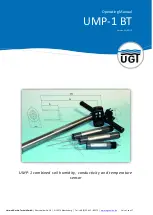
Page 1: ...l UMP 1 BT Version 22 05 19 Umwelt Ger te Technik GmbH Eberswalder Str 58 D 15374 M ncheberg Tel 49 0 33 43 2 89 575 www ugt online de Seite 1 von 17 UMP 1 combined soil humidity conductivity and temp...

Page 2: ...nformation 5 2 1 Structure and basic function 5 2 2 Technical data 6 3 Volumetric water content of the soil 7 4 Mode of operation 7 4 1 Water content measurement 7 4 2 Electrical conductivity measurem...

Page 3: ...rement and time spent on installation and servicing In addition soil disturbance is reduced because only one sensor has to be installed in order to measure three soil properties In Addition to the cab...

Page 4: ...any questions or feedback Email info ugt online de or support ugt online de Phone 49 0 33432 89 575 Fax 49 0 33432 89 573 If contacting us by email or fax please include as part of your message your...

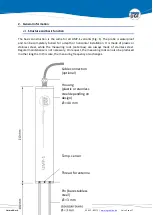
Page 5: ...be completely buried for a depth or horizontal installation It is made of plastic or stainless steel while the measuring rods antennas are always made of stainless steel Regular maintenance is not nec...

Page 6: ...24V DC Power input 60 mA Water content Measurement range 0 100 vol water content Accuracy 2 Resolution 0 1 vol water content Electrical conductivity Measurement range 0 001 4mS cm Optional measuremen...

Page 7: ...er to the FDR sensors nor the TDR sensors The basic mode of operation however corresponds to the FDR process because the sensor operates with a continuous signal at constant frequency 60 MHz and not w...

Page 8: ...ent is interrupted for a sort time and a signal in the kHz range transmitted over the antennae The corresponding IC measures the impedance of several different frequencies and averages the results 4 3...

Page 9: ...es fast work for taking many single measurements in a row Despite the different design the two probes hardly vary in the basics of operation just in the practical adjustment to their core tasks By pre...

Page 10: ...cap of the charge socket bajonet cap and connect the probe to either the USB port of your PC or a socket using the provided cable and adapter 7 Data output 7 1 App Installation The app is already inst...

Page 11: ...ity is available install a free file manager from the App Store for example the ES File Explorer and use this to click on the copied file 5 Select Install and follow the instructions on the screen 6 A...

Page 12: ...probes listed in this view are possible The use of Bluetooth restricts the maximum number of simultaneous connections to 7 although the actual app can manage more than 7 probes This dialogue also pro...

Page 13: ...ave been successfully implemented the dialogue closes and the main menu reappears If the dialogue does not close automatically a fault has occurred with at least one probe and is displayed in Box 2 of...

Page 14: ...t Temperature in C Conductivity mS cm a View as graph In this view mode the measured data are displayed as chart 30 measurements are always displayed simultaneously and continuously From 5 measurement...

Page 15: ...ts The recorded files are stored in the external memory of the device so that the files can be downloaded e g to a PC The first time recording takes place the folder UMP1 is created in the file system...

Page 16: ...reen orientation should be portrait or landscape Disable large images prevent large images such as background images being used in the app 7 3 Troubleshooting Error code Description Causes solutions 1...

Page 17: ...74 M ncheberg Tel 49 0 33 43 2 89 575 www ugt online de Seite 17 von 17 Can t access file 6 Fehler beim Datei lesen Can t read file 7 Falsches Dateiformat Wrong file format 8 Interner Systemfehler Int...

Reviews: