Exo x6a Operations Manual
revision 1
1st September 2013
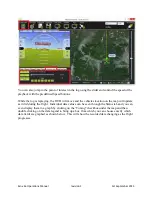
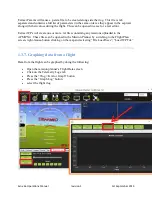
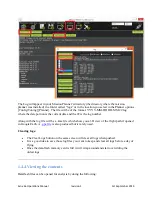
You can also jump to the point of interest in the log using the slider and control the speed of the
playback with the predefined Speed buttons.
While the log is replaying, the HUD will move and the vehicles location on the map will update
as it did during the flight. Individual data values can be seen through the Status tab and you can
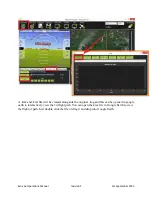
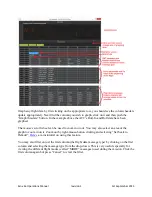
even display them in a graph by clicking on the “Tuning” checkbox under the map and then
double clicking on the data legend to bring up a box from which you can choose exactly which
data fields are graphed as shown below. This will show the recorded data changing as the flight
progresses.

