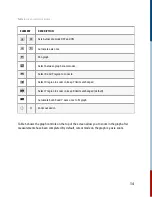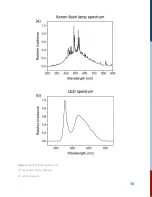
For emission measurements, click on the Emission radio button. Make sure the Range is not set to
Auto, i.e., the check box should be empty. In this mode, only the Xe source will be activated. Trial
and error are required to select the appropriate Range using the slider to obtain good signal-to-
noise.
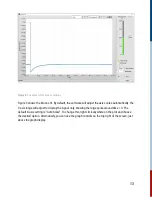
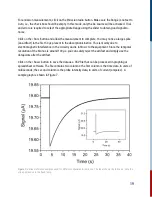
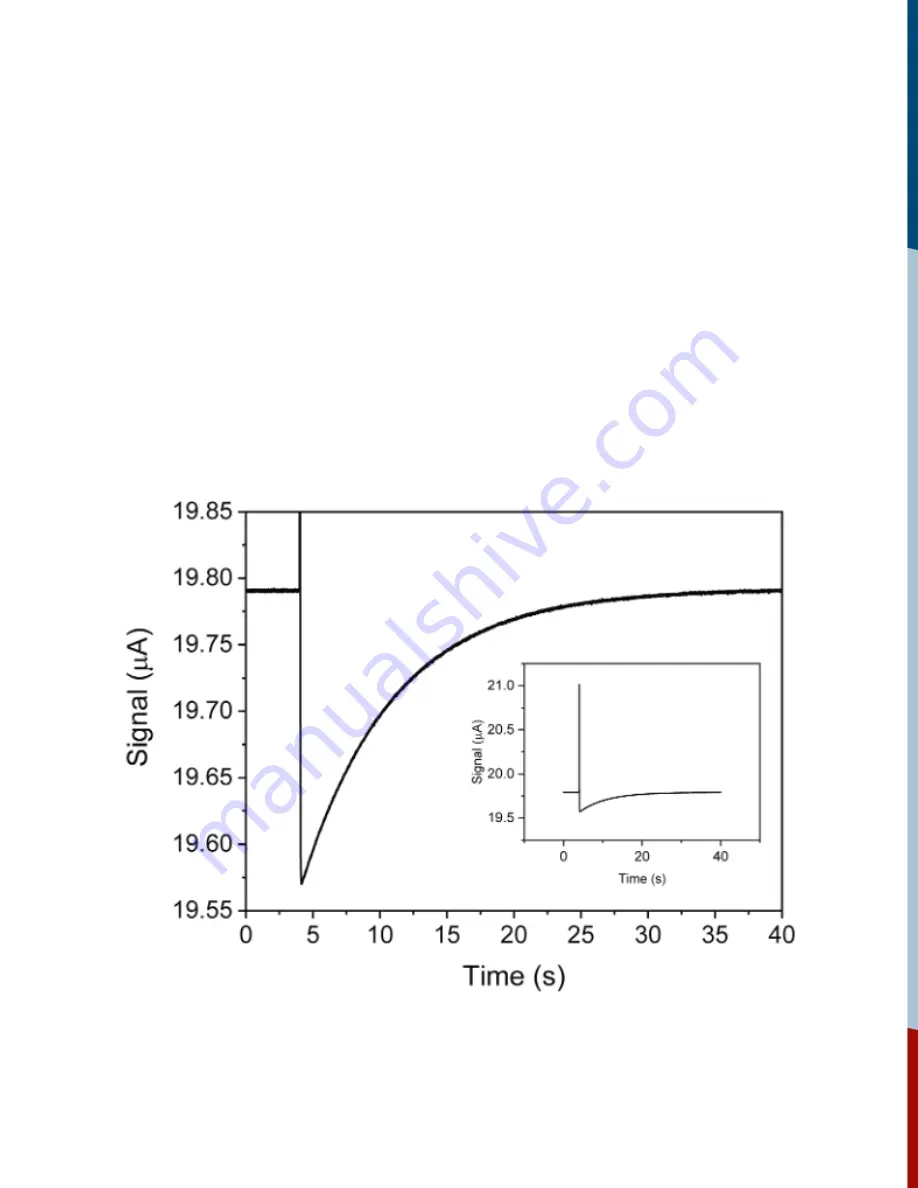
Click on the <Run> button and allow the measurement to complete. You may notice a large spike
(an artifact) in the first 50 μs present in the absorption kinetics. This is mainly due to
electromagnetic interference in the circuitry and is intrinsic to the equipment. Since the temporal
resolution of the Kronos is around 100 μs, you can safely reject the artifact and simply use the
datapoints after the artifact.
Click on the <Save> button to save the data as a CSV file that can be processed in graphing or
spreadsheet software. The file contains two columns: the first column is the time data, in units of
milliseconds; the second column is the probe intensity data, in units of current (amperes). A
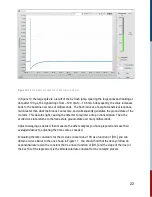
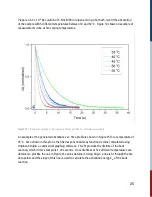
sample graph is shown in Figure 7.
Figure 7:
Various reference samples used for different experiments in Kronos. The inset shows the full curve; note the
strong spike due to the flash lamp.
19

