Table of Figures
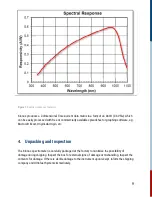
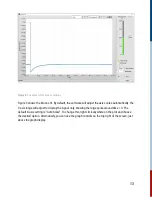
Figure 1: Spectral response of detector.
....................................................................................9
.................................................................................................10
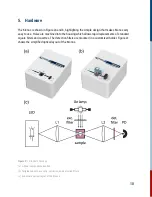
(a) without components inserted
.........................................................................................10
(b) fully loaded with a cuvette, excitation, and detection filters
..............................................10
(c) Schematic optical layout of the Kronos
...........................................................................10
Figure 3: Screenshot of the Kronos software.
..........................................................................13
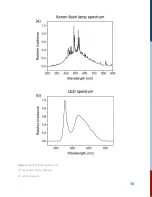
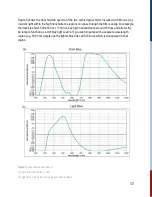
Figure 4: Spectra of Kronos light sources:
...............................................................................16
(a) Xenon flash lamp for the pump
.......................................................................................16
Figure 5: Transmission spectrum of
........................................................................................17
(a) dark blue or 350-400 + >700
...........................................................................................17
(b) light blue or 400-700 colored glass excitation filters
........................................................17
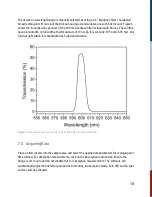
Figure 6: Transmission spectrum of 600 nm detection dielectric interference filter.
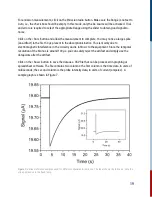
Figure 7: Various reference samples used for different experiments in Kronos. The inset shows
the full curve; note the strong spike due to the flash lamp.
.........................................19
Figure 9: Ground state absorption spectrum of Congo Red (trans conf.) in 20% water/ethanol.
Figure 10: Kinetic profile of Congo Red in 20% water in ethanol.
...............................................22
Figure 11: Calculated and fitted ΔA plot.
.................................................................................23
Figure 12: Structure and photochromic reaction of 6-NO-BIPS.
.................................................24
Figure 13: Ground state absorption spectrum of One Spiropyran in toluene.
..............................24
Figure 14: Transient absorption of Spiropyran in Toluene at 600 nm detection wavelength.
Figure 15: Example decay and exponential fit for 55°C measurement.
.......................................26
Figure 16: Actual data example of ln(τ) as a function of 1000/T.
..............................................26
Figure 17: Photophysical and photochemical sequence in light-matter interactions.
4


